
Meet the New Park Factors – Part II
April 13, 2010 by John Cappello · 1 Comment
[In Part I , we saw that traditional Park Factors do have a place in baseball—just not for measuring ballpark impact. In Part II here, we’ll mix some physics with home run trajectories to help us understand how a future system for rating ballparks might be designed. In Part III, we’ll see what this system might actually look like.]
***
Imagine walking down the aisle of your favorite ballpark. Go ahead and sit down right behind home plate. You’re allowed—it’s your imagination. Look out on the field. There are no players. There is no game. At home plate sits a regulation baseball and bat.

Oh, and you’re toting a laptop.
This is our laboratory for creating a new Ballpark Impact (BPI) rating system. Excuse the acronym; such a system doesn’t exist. Not yet anyway. But enough research is being done in this area that it’s just a matter of time before there’s a better way of measuring a ballpark’s influence on baseball statistics.
Before getting to that research, we’re going to hash through a few fundamentals on the flight of a baseball to get a better appreciation of how ballparks do impact performance. So go ahead pour your favorite caffeinated beverage…we’ll need to get a few more neurons firing than usual.
There are two components to characterizing a ballpark’s influence on offense: the physical environment and performance feedback . We got a flavor of performance feedback in Part I when we rated the trajectories of every home run hit at Citi Field and Citizens Bank Park in 2009 and saw how vulnerable those ballparks were to home runs. We’ll come back to these feedback techniques later.
The physical environment takes us back to our laboratory—the empty field—where no performance data is allowed. Here, we’re just interested in the elements of physics that contribute to sending a baseball over any part of the fence. We’re essentially quantifying the answer to the question, “What would it take to hit a home run in this ballpark?†
Home runs can be hit with trajectories ranging from clothesline lasers to parabolic cloud scrapers. For each possible ball flight—from foul pole to foul pole—there’s a minimum force that must be supplied by the bat at impact to send the ball a long enough distance to carry a fence of a certain height so many feet away. The lower this force is, the easier it would be to hit a home run. This collection of minimum forces is unique for each ballpark, since every home field is built differently.
This is our baseline for measuring a park’s impact.
One way to translate the amount of force that was supplied to the baseball at impact is to measure a ball’s initial velocity as it rebounds off the bat and onto its trajectory. Commonly phrased as “speed off the bat,” or SOB , by the sabermetrics community, it’s the primary culprit behind flight distance. The ball’s initial velocity is a very revealing clue to its subsequent flight. In fact, if we dig deeper into the ball’s motion just after impact, a treasure chest of information can be found from those short milliseconds in time. It’s a microcosmic baseball moment that holds the key to understanding what theoretically should happen next versus what actually does happen next.
A ball’s trajectory will be strongly determined by the path it takes relative to the horizontal plane immediately after being struck by the bat. This measure, shown in the figure below, is known as the vertical launch angle (VLA), where 90 degrees would be straight up in the air, and 0 degrees would be a true line drive. Down into the negatives is ground ball territory. The direction the ball takes out onto the field is its horizontal launch angle (HLA).

The beautiful thing about knowing the ball speed and the launch angles at these moments is that we can assume that the ball hasn’t yet been affected by the atmosphere . We can figure out on paper how far and at what direction the ball should travel theoretically according to the principles of motion. This is roughly how we are able to analyze a ball hit in one ballpark and judge whether it would have been a home run in other ballparks.
But there are other issues we’ve got to deal with. We’ve only been touching our toes to the water so far.
The site of each major league ballpark has its own set of atmospheric conditions that affect ball flight, and subsequently, the minimum forces and SOBs needed to hit home runs. The ballpark’s altitude , or elevation above sea level, is the most consistent of these conditions. The higher the elevation, the “thinner†the air because of its lower air density. Thinner air means less drag on the ball’s flight, which generally results in longer distances. If you’re still wondering why, think of air density as one huge ball pit, the kind that kids like to roll around in. Imagine millions of those plastic balls just floating around in space, each representing an air molecule—air is a gas, after all. Picture a cannon ball fired through the space of plastic balls. The cannon ball’s trajectory is slowed by the collisions with the plastic balls along the way—this is how air drag slows down a baseball. Now take away 25% of the plastic balls. With more space between the balls, the cannon ball will go farther because there will be fewer collisions. This is the thinner air.
The elevations of all 30 ballparks are shown below (these are my best estimates using Google Earth—your mileage may vary):

For one sample trajectory*, a 400-foot home run hit at sea level would travel 407 feet at Chase Field, and 434 feet at Coors Field.
There’s another spin to this ball flight business, and I mean that literally. The angles at which the bat and ball meet imparts a spin on the ball that can dramatically affect its flight. One of the most recognized consequences of spin is “lift,” which describes the way a trajectory seems to defy gravity, at least for a few moments. A ball that is undercut just right will have backspin , resulting in an upward force perpendicular to the direction of the ball. This is called the Magnus force.
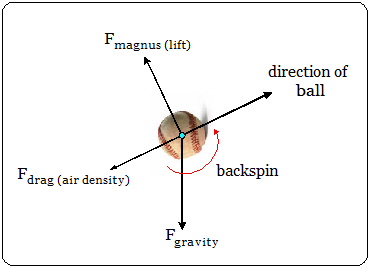
The Magnus force is small compared to the force of the bat on the ball or to gravity, but it’s enough to keep the ball in the air longer than if the ball wasn’t spinning. Think of how a sliced tennis ball or ping pong ball hovers just long enough to get over the net. In baseball, the result of this undercut is higher trajectories and longer distances. Yes, this also means there is scientific evidence that a hitter can increase his home run numbers by hitting with more lift. It’s also a terribly weak argument—albeit a convenient one—for steroid users who want to deflect attention from how their usage might have affected their performance; but that’s another post for another time.
Researchers have used lift to explain how a curve ball can theoretically be hit farther than a fast ball. Most of us have grown up thinking it was the other way around. A curve is already spinning in the same direction as an undercut baseball’s subsequent backspin, which adds to even greater backspin. A hopping four-seamer, on the other hand, has to be reversed to get the same lift, since it’s coming to the plate spinning in the opposite direction.
The Magnus force isn’t well understood, even by physicists. But they do recognize that there are ways spin comes into play regarding ball flights and minimum forces for hitting home runs. For one, the Magnus impact varies with the type of trajectory. Studies show that for higher spin rates, the longest distances are reached with smaller launch angles. Spin is also affected by air density. The thinner the air, the less the ball will spin, lowering the Magnus force. It’s why curve balls don’t bite as much at Coors Field—which brings up an interesting conflict at higher altitudes. A batter will gain distance due to thinner air because of less drag, but will lose distance due to less spin. Generally speaking, less drag wins out and the batter will still gain in distance overall. But for smaller launch angles and high backspin, it’s theorized that Magnus dominates, making such a trajectory at sea level actually travel farther than if it occurred at Coors Field. What a switch that is.
Again, these behaviors aren’t entirely understood but are commonly factored into trajectory calculations.
So far we’ve been talking about the characterization of ballpark impact in a “raw” sense. The variables we’ve been dealing with—fence height, fence distance, altitude and spin—are “controlled†ones that don’t waver. We could throw different combinations of these numbers into a simulation program and vary the angles and lift factors to our heart’s content to come up with a reasonable measure as to how a ballpark’s dimensions and altitude impacts the ability to hit a home run. Greg Rybarczyk of hittrackeronline.com ran through this exercise back in 2007 . (Yes, some people have been thinking about this issue for years.)
If only it were that easy.
There’s a few atmospheric elements that makes what we’re trying to do really difficult. Temperature and wind can change drastically throughout the baseball season in every ballpark, sometimes by the inning. To say that this puts a challenging dynamic to measuring the ballpark effect is like saying Babe Ruth was a decent hitter and a pretty popular dude. Just to give you an idea, the difference between hitting into a 5 mph wind on a 65 degree day and hitting with the same wind blowing out on a 95 degree day could be as much as 30 to 40 feet in total distance, depending on the type of trajectory.
Warmer temperatures mean less dense air and a more elastic baseball. Temperature isn’t as volatile as wind, but we know it can swing throughout the season, at different cities, and at different times of the day. At the very least, we might get away with averaging game-time temperatures as some sort of basis for our BPI numbers.
But wind can be a monster . This great invisible force can be gusty and swirling, calm or strong. Wind is arguably the most influential ballpark effect, at least for balls hit in the air. Think of going down 2-3 clubs in golf when you’re facing a strong downwind. That’s a lot of yardage to compensate for.
And unfortunately, wind is very hard to model.
When baseball experts try to gauge the wind of a ballpark, they’ll talk about the openness of the seating and structures surrounding the field, and the presence of nearby buildings or bodies of water. PNC Park in Pittsburgh, wide open beyond centerfield and just off the Allegheny River, is going to present fly balls with a different set of wind characteristics then the completely-surrounded Rangers Ballpark in Arlington, Texas, which sits as inland as a park can be.

Interestingly, out of the 28 “luckiest” home runs hit at Citizens Bank Park in 2009 using our HR Legit ratings from Part I of this post, 75% were influenced by a wind of 10 mph or more, according to Hit Tracker data. The Philly breeze seems to be as generous to hitters over there at the Bank as the field dimensions.

Measuring the difficulty of hitting a home run in a ballpark considering only its physical environment certainly isn’t a walk in the park. The wind element alone messes with the mind of a baseball analyst like a faucet drip does to an obsessive-compulsive. He who toys with wind factors can very easily get burned.
Which brings us to the next challenge: how are we going to measure these things?
Lucky for baseball fans, the sport has became a passion for a couple of highly respected physicists who have managed to break down some huge knowledge barriers in describing how the game is played. Back in ’87, a Yale professor was anointed “Physicist to the National League” by his old friend, baseball commissioner Bart Giamatti, also a Yale alum. Dr. Robert Adair took his new post seriously and generated enough new insight on the game to fill a book. So he published The Physics of Baseball , which instantly became gospel for a baseball world that never ceases to search for a greater understanding of the game. Just as Bill James did for a generation of statisticians, economists, and others skilled at dealing with numbers, Adair’s book has inspired more than a few enthusiasts to apply theories first posed by Galileo and Sir Isaac Newton hundreds of years ago to the mechanics of throwing and hitting a baseball.
After reading Adair’s book, Dr. Alan Nathan was hooked. A PhD in physics from Princeton and currently a physics professor at the University of Illinois, Nathan has become the go-to voice of reason on the subject of physics in baseball, and has commented, presented, and shared his own expertise and research for countless contemporary baseball thinkers.
Take, for instance, early in 2009, when the chatter around baseball turned to the home runs that seemed to be leaving the new Yankee Stadium by the bucketful. Most theorized that this had to do with some abnormal jet stream flowing toward right-center. Nathan studied the situation by analyzing all 819 home runs that were hit during the first six weeks of the season. The approach he took reflects the sabermetric techniques of the future, and will play a key role for any scheme devised for measuring ballpark impact.
Nathan used HITf/x , a measurement and analysis system based on a set of permanently-installed video cameras at every ML ballpark. HITf/x can track a baseball immediately after the bat-ball collision and generate all kinds of readings about a ball’s motion just as it is starting on its trajectory. PITCHf/x , the predecessor to HITf/x, tracks the ball as it leaves the pitcher’s hand all the way to home plate. Aside from providing the snazzy graphics for MLB.com Gameday and telecasts for Fox Sports and ESPN, these technologies have triggered new dimensions for breaking down raw baseball data.

Nathan captured the initial conditions of those early-season home runs to determine each ball’s theoretical and unimpeded trajectory. To complete the picture, he used Greg Rybarczyk’s Hit Tracker to identify the projected landing spot of each home run had the ball not been interrupted in flight by any structures above the surface of the playing field, yielding the ball’s true distance from home plate. Nathan then figured out how much each home run carried in distance beyond what would have been expected if the ball wasn’t influenced by any aerodynamic effects, such as drag and wind. After normalizing the Yankee ballpark data to league averages, Nathan did not find any evidence of the alleged jet stream that seemed to be carting baseballs out into the right field stands at the Yankees new home field. His results suggested that, if anything, the carry of home runs hit at the new Yankee Stadium was actually below league average.
An interesting conclusion. But what is more interesting here is what Nathan’s analysis does for our bigger picture, a new Ballpark Impact system. He was able to characterize a baseball’s carry in every ballpark, at least for those six weeks in early 2009. He also calculated the average speed of the ball off the bat for each park, which is another way of describing how easy (lower ball speed) or how hard (higher ball speed) it was to hit home runs in each ballpark during that time period.
Between HITf/x, Nathan’s thought processes, and Rybarczyk’s Hit Tracker, it’s possible to track the living daylights out of any fly ball that so much has a passing thought of leaving the premises, giving us the ultimate performance feedback to tie into a new system for measuring a ballpark’s impact on home runs.
What might this system look like? We’ll tie it all together in Part III. (I promise this won’t turn into a Rocky series.)
— John Cappello
John Cappello is a member of SABR who believes that this is a great time to be in love with baseball and numbers because the tools of insight are out there for anyone willing take them for a ride, and it’s only going to get better. To see more of John’s baseball research and postings, go to www.baseballengineer.com .
***Notes & Acknowledgements
I owe much of this content to the writings of Robert Adair and correspondence with Alan Nathan and Greg Rybarczyk. Here’s hoping my comments haven’t broken any Newtonian laws of motion.
*These results are from using Alan Nathan’s trajectory calculator that was downloaded here , using these parameters: SOB = 102.6 mph, VLA = 30 degrees, spin rate = 2000 rpm, temp = 72 deg F.
PITCHf/x is controlled by the technology and software of Sportvision .
Source: Sawicki, Gregory S. and Mont Hubbard, and William J. Stronge, “How to Hit Home Runs: Optimum Baseball Bat Swing Parameters for Maximum Range Trajectories,” American Journal of Physics , Vol. 71 1152, 2003.
Apparently, I did tweak the theory of physics on a couple of points, so I made two minor edits to this post. I updated the “Magnus force” image so that this force is correctly pointing in a direction perpendicular to the ball’s flight—not opposite from gravity. Note that the Magnus force would point in the opposite direction as shown in this figure if the ball had topspin. Thank you Alan Nathan. Alan also noted a misinterpretation on my part regarding a bat barrel’s speed through the bat-ball collision. I removed that particular paragraph to avoid confusion.