
This tutorial introduces you to geospatial analytics. Geospatial analytics let you easily analyze and visualize geospatial data in BigQuery.
Objectives
In this tutorial, you:
- Use a geospatial analytics function to convert latitude and longitude columns into geographical points
- Run a query that plots the path of a hurricane
- Visualize your results in BigQuery
- Visualize your results in BigQuery Geo Viz
Costs
BigQuery is a paid product and you will incur BigQuery usage in this tutorial. BigQuery offers some resources free of charge up to a specific limit. For more information, see BigQuery free operations and free tier .
Before you begin
Before you begin this tutorial, use the Google Cloud console to create or select a project.
- Sign in to your Google Cloud account. If you're new to Google Cloud, create an account to evaluate how our products perform in real-world scenarios. New customers also get $300 in free credits to run, test, and deploy workloads.
-
In the Google Cloud console, on the project selector page, select or create a Google Cloud project.
Roles required to select or create a project
- Select a project : Selecting a project doesn't require a specific IAM role—you can select any project that you've been granted a role on.
- Create a project
: To create a project, you need the Project Creator role
(
roles/resourcemanager.projectCreator), which contains theresourcemanager.projects.createpermission. Learn how to grant roles .
- BigQuery is automatically enabled in new projects.
To activate BigQuery in an existing project, go to
Enable the BigQuery API.
Roles required to enable APIs
To enable APIs, you need the Service Usage Admin IAM role (
roles/serviceusage.serviceUsageAdmin), which contains theserviceusage.services.enablepermission. Learn how to grant roles . - Optional: Enable billing for the project. If you don't want to enable billing or provide a credit card, the steps in this document still work. BigQuery provides you a sandbox to perform the steps. For more information, see Enable the BigQuery sandbox .
Explore the sample data
This tutorial uses a dataset available through the Google Cloud Public Dataset Program . A public dataset is any dataset that is stored in BigQuery and made available to the general public. The public datasets are datasets that BigQuery hosts for you to access and integrate into your applications. Google pays for the storage of these datasets and provides public access to the data by using a project . You pay only for the queries that you perform on the data (the first 1 TB per month is free, subject to query pricing details ).
The Global Hurricane Tracks (IBTrACS) dataset
Global Hurricane Tracks (IBTrACS) dataset
The historical positions and intensities along the tracks of global tropical cyclones (TC) are provided by NOAA's International Best Track Archive for Climate Stewardship (IBTrACS). Tropical cyclones are known as hurricanes in the north Atlantic and northeast Pacific ocean basins, typhoons in the northwest Pacific ocean basin, cyclones in the north and south Indian Ocean basins, and tropical cyclones in the southwest Pacific ocean basin.
IBTrACS collects data about TCs reported by international monitoring centers who have a responsibility to forecast and report on TCs (and also includes some important historical datasets). IBTrACS includes data from 9 different countries. Historically, the data describing these systems has included best estimates of their track and intensity (hence the term, best track).
You can start exploring this data in the Google Cloud console by
viewing the details of the hurricanes
table:
Query the path of hurricane Maria in 2017
In this section of the tutorial, you run a GoogleSQL query that finds the path of hurricane Maria in the 2017 season. To plot the hurricane's path, you query the hurricane's location at different points in time.
Query details
The following GoogleSQL query is used to find the path of hurricane Maria.
 SELECT

 ST_GeogPoint
 (
 longitude
 ,

 latitude
 )

 AS

 point
 ,

 name
 ,

 iso_time
 ,

 dist2land
 ,

 usa_wind
 ,

 usa_pressure
 ,

 usa_sshs
 ,

 (
 usa_r34_ne

 +

 usa_r34_nw

 +

 usa_r34_se

 +

 usa_r34_sw
 )
 /
 4

 AS

 radius_34kt
 ,

 (
 usa_r50_ne

 +

 usa_r50_nw

 +

 usa_r50_se

 +

 usa_r50_sw
 )
 /
 4

 AS

 radius_50kt
 FROM

 `bigquery-public-data.noaa_hurricanes.hurricanes`
 WHERE

 name

 LIKE

 '%MARIA%'

 AND

 season

 =

 '2017'

 AND

 ST_DWithin
 (
 ST_GeogFromText
 (
 'POLYGON((-179 26, -179 48, -10 48, -10 26, -100 -10.1, -179 26))'
 ),

 ST_GeogPoint
 (
 longitude
 ,

 latitude
 ),

 10
 )
 ORDER

 BY

 iso_time

 ASC
The query clauses do the following:
-
-
SELECT ST_GeogPoint(longitude, latitude) AS point, name, iso_time, dist2land, usa_wind, usa_pressure, usa_sshs, (usa_r34_ne + usa_r34_nw + usa_r34_se + usa_r34_sw)/4 AS radius_34kt, (usa_r50_ne + usa_r50_nw + usa_r50_se + usa_r50_sw)/4 AS radius_50kt - The
SELECTclause selects all the storm's weather data and uses theST_GeogPointfunction to convert the values in thelatitudeandlongitudecolumns toGEOGRAPHYtypes (points).
-
-
-
FROMbigquery-public-data.noaa_hurricanes.hurricanes - The
FROMclause specifies the table being queried:hurricanes.
-
-
-
WHERE name LIKE '%MARIA%' AND season = '2017' AND ST_DWithin(ST_GeogFromText('POLYGON((-179 26, -179 48, -10 48, -10 26, -100 -10.1, -179 26))'), ST_GeogPoint(longitude, latitude), 10) - The
WHEREclause filters the data to just the points in the Atlantic corresponding to hurricane Maria in the 2017 hurricane season.
-
-
-
ORDER BY iso_time ASC - The
ORDER BYclause orders the points to form a chronological storm path.
-
Run the query
To run the query by using the Google Cloud console:
-
Go to the BigQuery page in the Google Cloud console.
-
Enter the following GoogleSQL query in the Query editortext area.
 SELECT

 ST_GeogPoint
 (
 longitude
 ,

 latitude
 )

 AS

 point
 ,

 name
 ,

 iso_time
 ,

 dist2land
 ,

 usa_wind
 ,

 usa_pressure
 ,

 usa_sshs
 ,

 (
 usa_r34_ne

 +

 usa_r34_nw

 +

 usa_r34_se

 +

 usa_r34_sw
 )
 /
 4

 AS

 radius_34kt
 ,

 (
 usa_r50_ne

 +

 usa_r50_nw

 +

 usa_r50_se

 +

 usa_r50_sw
 )
 /
 4

 AS

 radius_50kt
 FROM

 `bigquery-public-data.noaa_hurricanes.hurricanes`
 WHERE

 name

 LIKE

 '%MARIA%'

 AND

 season

 =

 '2017'

 AND

 ST_DWithin
 (
 ST_GeogFromText
 (
 'POLYGON((-179 26, -179 48, -10 48, -10 26, -100 -10.1, -179 26))'
 ),

 ST_GeogPoint
 (
 longitude
 ,

 latitude
 ),

 10
 )
 ORDER

 BY

 iso_time

 ASC
-
Click Run.
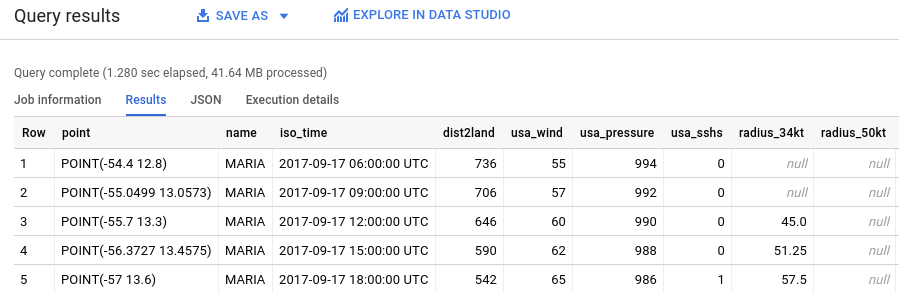
The query takes a moment to complete. After the query runs, your results appear in the Query resultspane.
Visualize the query results in BigQuery
To visualize your results in BigQuery, follow these steps:
-
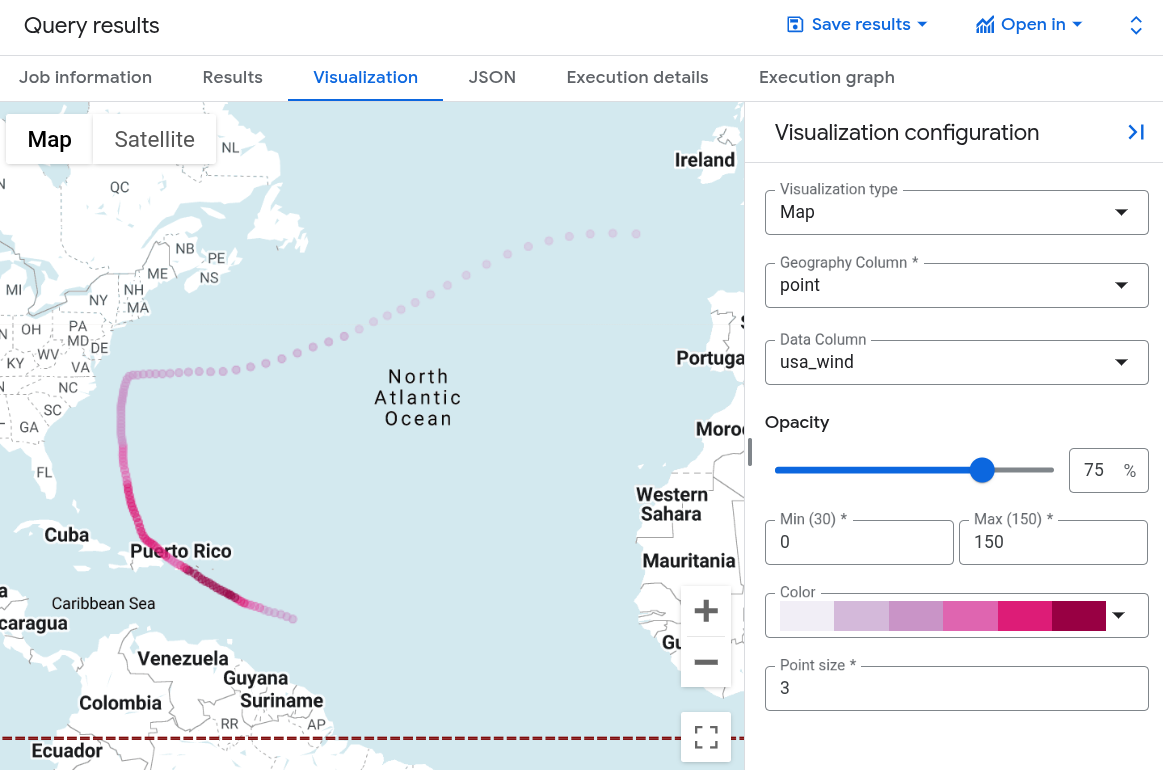
To visualize your results in BigQuery, in the Query resultspane, click Visualization.
-
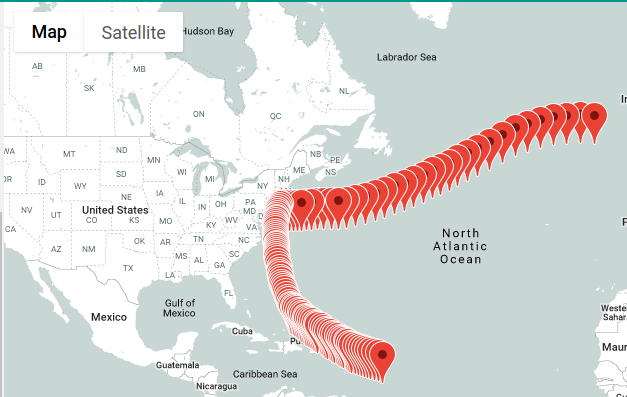
For Data column, select
usa_wind.A map appears with points for the hurricane's location over time, styled by a color gradient for wind speed.
-
Optional: To adjust the visibility of the points, set Minto 0 and select a different color gradient from the Colorlist.
Visualize the query results in Geo Viz
You can also visualize your results using BigQuery Geo Viz — A web tool for visualization of geospatial data in BigQuery using Google Maps APIs.
Launch Geo Viz and authenticate
Before using Geo Viz, you must authenticate and grant access to data in BigQuery.
To set up Geo Viz:
-
Open the Geo Viz web tool.
-
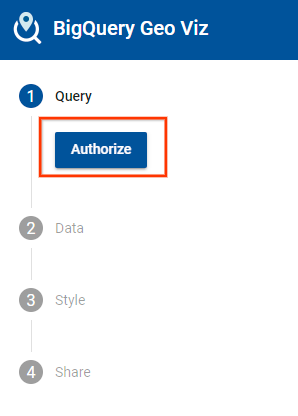
Under step one, Select data, click Authorize.
-
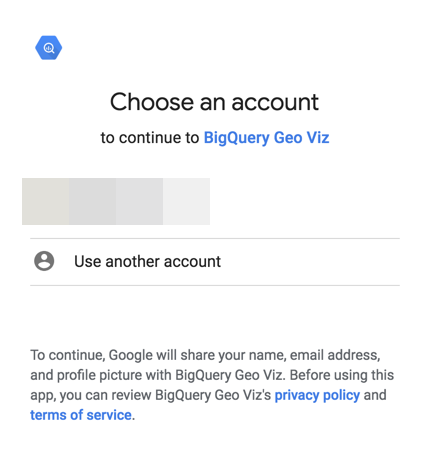
In the Choose an accountdialog, click your Google Account.
-
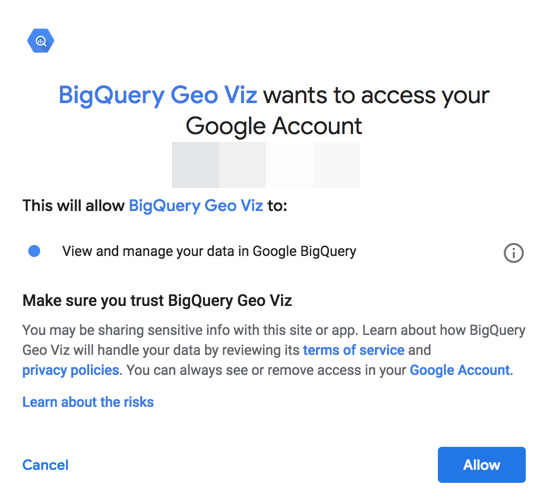
In the access dialog, click Allowto give Geo Viz access to your BigQuery data.
Run your query in Geo Viz
After you authenticate and grant access, the next step is to run the query in Geo Viz.
To run the query:
-
For step one, Select data, enter your project ID in the Project IDfield.
-
In the query window, enter the following GoogleSQL query.
 SELECT

 ST_GeogPoint
 (
 longitude
 ,

 latitude
 )

 AS

 point
 ,

 name
 ,

 iso_time
 ,

 dist2land
 ,

 usa_wind
 ,

 usa_pressure
 ,

 usa_sshs
 ,

 (
 usa_r34_ne

 +

 usa_r34_nw

 +

 usa_r34_se

 +

 usa_r34_sw
 )
 /
 4

 AS

 radius_34kt
 ,

 (
 usa_r50_ne

 +

 usa_r50_nw

 +

 usa_r50_se

 +

 usa_r50_sw
 )
 /
 4

 AS

 radius_50kt
 FROM

 `bigquery-public-data.noaa_hurricanes.hurricanes`
 WHERE

 name

 LIKE

 '%MARIA%'

 AND

 season

 =

 '2017'

 AND

 ST_DWithin
 (
 ST_GeogFromText
 (
 'POLYGON((-179 26, -179 48, -10 48, -10 26, -100 -10.1, -179 26))'
 ),

 ST_GeogPoint
 (
 longitude
 ,

 latitude
 ),

 10
 )
 ORDER

 BY

 iso_time

 ASC
-
Click Run.
-
When the query completes, click Show results. You can also click step two Data.
-
This moves you to step two. In step two, for Geometry column, choose point. This plots the points corresponding to hurricane Maria's path.
Format your visualization in Geo Viz
The Stylesection provides a list of visual styles for customization. For more information about style properties and values, see Format your visualization .
To format your map:
-
Click Add stylesin step two or click step 3 Style.
-
Change the color of your points. Click fillColor.
-
In the fillColorpanel:
- Click Data driven.
- For Function, choose linear.
- For Field, choose
usa_wind. - For Domain, enter
0in the first box and150in the second. -
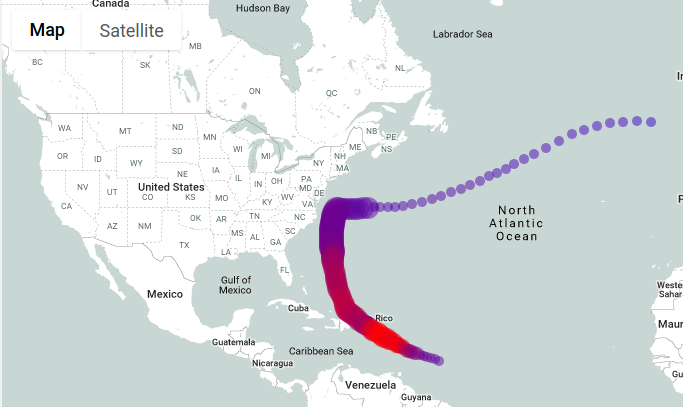
For Range, click the first box and enter
#0006ffin the Hexbox. Click the second box and enter#ff0000. This changes the color of the point based on the wind speed. Blue for lighter winds and red for stronger winds.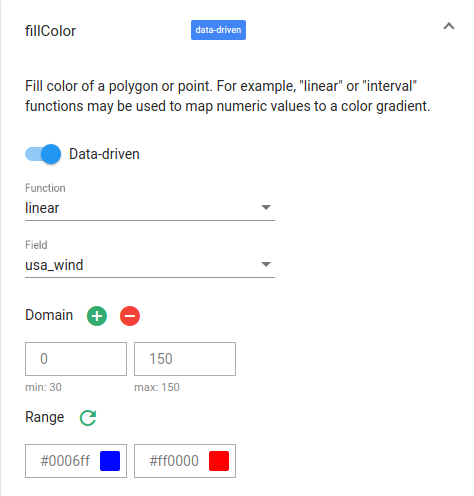
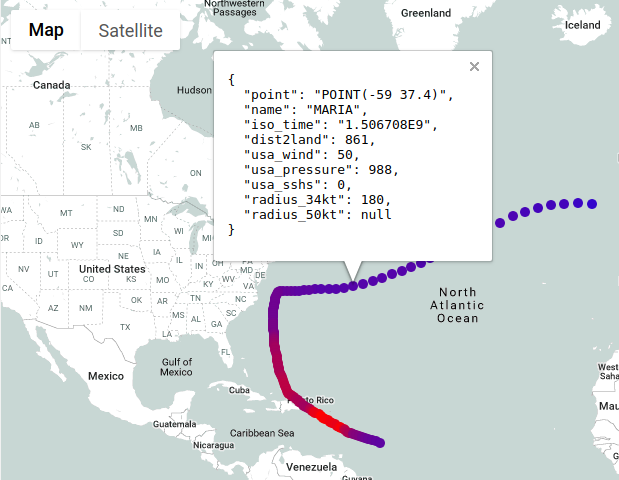
-
Examine your map. If you hold the pointer over on one of your points, the point's weather data is displayed.
-
Click fillOpacity.
-
In the Valuefield, enter .5.
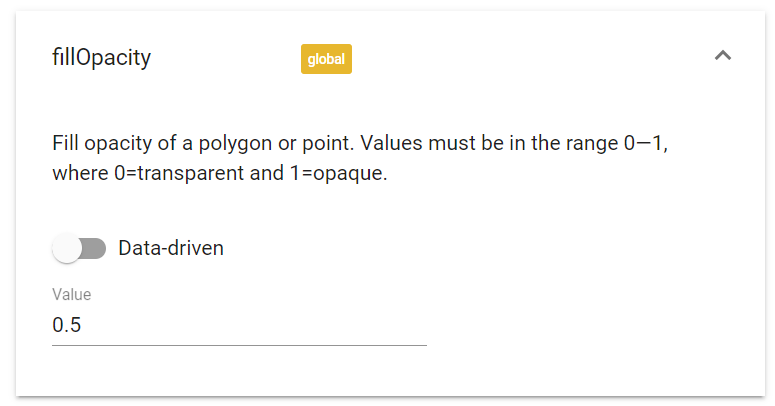
-
Examine your map. The fill color of the points is now semi-transparent.
-
Change the size of the points based on the hurricane's radius. Click circleRadius.
-
In the circleRadiuspanel:
- Click Data driven.
- For Function, choose linear.
- For Field, choose
radius_50kt. - For Domain, enter
0in the first box and135in the second. -
For Range, enter
5in the first box and135000in the second.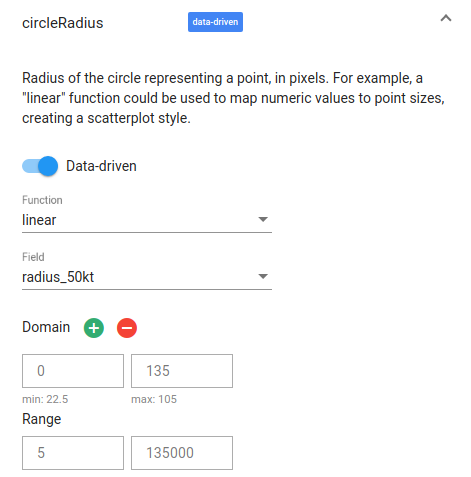
-
Examine your map. The radius of each point now corresponds to the radius of the hurricane.
-
Close Geo Viz.
Clean up
To avoid incurring charges to your Google Cloud account for the resources used in this tutorial, either delete the project that contains the resources, or keep the project and delete the individual resources.
- You can delete the project you created.
- Or you can keep the project for future use.
To delete the project:
- In the Google Cloud console, go to the Manage resources page.
- In the project list, select the project that you want to delete, and then click Delete .
- In the dialog, type the project ID, and then click Shut down to delete the project.
What's next
- To learn more about how to visualize options for geospatial analytics, see Visualizing geospatial data .
- To work with geospatial data, see Working with geospatial data .
- To learn more about the geography functions you can use in geospatial analytics, see Geography functions in GoogleSQL .