
After you create an app you can enable app monitoring during the deployment step, and then view metrics about the app's performance.
Deploy an app with monitoring enabled
After you have built an end-to-end application with all the necessary components you must deploy the app to start using it. When you deploy you have the option to enable monitoring.
Console
-
Open the Applicationstab of the Gemini Enterprise Agent Platform Vision dashboard.
-
Select View appnext to the name of your application from the list.
-
From the application graph builder page click the Deploybutton.
-
In the Deploy applicationmenu that opens, select any other options and select Enable monitoring for this application.
-
Click Deploy.
After deployment completes there will be green check marks next to the nodes.
View app monitoring metrics
After an app has been deployed for several minutes, you can access some app metrics, such as graphs indicating the request counts made to various external services (such as BigQuery or Cloud Run functions) from various models.
Console
-
Open the Applicationstab of the Gemini Enterprise Agent Platform Vision dashboard.
-
Select View appnext to the name of your application from the list.
-
From the application graph builder page click the View detailsbutton.
In this view you can see metrics, such as app request count and uptime.
-
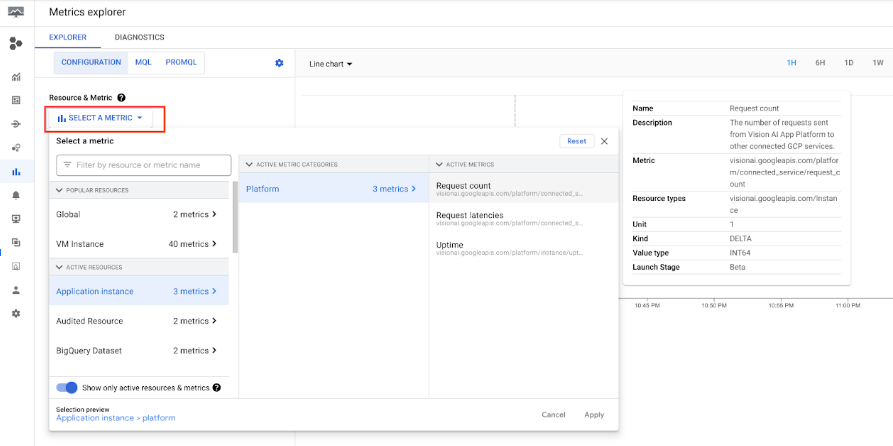
For a more detailed view, click the Open Metrics Explorerbutton.
-
To view a specific metric, click Select a metricand choose the metric.
What's next
- Read instructions about how to begin data ingestion from an app's input stream in Create and manage streams .
- Learn how to list apps and view a deployed app's instances in Managing applications .
- Learn how to read app input data from an ingestion stream or analyzed model output data in Read stream data .