
Use custom holidays in an ARIMA_PLUS time-series forecasting model
This tutorial shows you how to do the following tasks:
- Create an
ARIMA_PLUStime-series forecasting model that uses only built-in holidays. - Create an
ARIMA_PLUStime-series forecasting model that uses custom holidays in addition to built-in holidays. - Visualize the forecasted results from these models.
- Inspect a model to see which holidays it models.
- Evaluate the effects of the custom holidays on the forecasted results.
- Compare the performance of the model that uses only built-in holidays to the performance of the model that uses custom holidays in addition to built-in holidays.
This tutorial uses the bigquery-public-data.wikipedia.pageviews_*
public tables.
Required permissions
-
To create the dataset, you need the
bigquery.datasets.createIAM permission. -
To create the model, you need the following permissions:
-
bigquery.jobs.create -
bigquery.models.create -
bigquery.models.getData -
bigquery.models.updateData
-
-
To run inference, you need the following permissions:
-
bigquery.models.getData -
bigquery.jobs.create
-
For more information about IAM roles and permissions in BigQuery, see Introduction to IAM .
Costs
In this document, you use the following billable components of Google Cloud:
- BigQuery: You incur costs for the data you process in BigQuery.
To generate a cost estimate based on your projected usage, use the pricing calculator .
For more information, see BigQuery pricing .
Before you begin
- Sign in to your Google Cloud account. If you're new to Google Cloud, create an account to evaluate how our products perform in real-world scenarios. New customers also get $300 in free credits to run, test, and deploy workloads.
-
In the Google Cloud console, on the project selector page, select or create a Google Cloud project.
Roles required to select or create a project
- Select a project : Selecting a project doesn't require a specific IAM role—you can select any project that you've been granted a role on.
- Create a project
: To create a project, you need the Project Creator role
(
roles/resourcemanager.projectCreator), which contains theresourcemanager.projects.createpermission. Learn how to grant roles .
-
Verify that billing is enabled for your Google Cloud project .
-
Enable the BigQuery API.
Roles required to enable APIs
To enable APIs, you need the Service Usage Admin IAM role (
roles/serviceusage.serviceUsageAdmin), which contains theserviceusage.services.enablepermission. Learn how to grant roles . -
In the Google Cloud console, on the project selector page, select or create a Google Cloud project.
Roles required to select or create a project
- Select a project : Selecting a project doesn't require a specific IAM role—you can select any project that you've been granted a role on.
- Create a project
: To create a project, you need the Project Creator role
(
roles/resourcemanager.projectCreator), which contains theresourcemanager.projects.createpermission. Learn how to grant roles .
-
Verify that billing is enabled for your Google Cloud project .
-
Enable the BigQuery API.
Roles required to enable APIs
To enable APIs, you need the Service Usage Admin IAM role (
roles/serviceusage.serviceUsageAdmin), which contains theserviceusage.services.enablepermission. Learn how to grant roles .
Create a dataset
Create a BigQuery dataset to store your ML model.
Console
-
In the Google Cloud console, go to the BigQuerypage.
-
In the Explorerpane, click your project name.
-
Click View actions > Create dataset
-
On the Create datasetpage, do the following:
-
For Dataset ID, enter
bqml_tutorial. -
For Location type, select Multi-region, and then select US.
-
Leave the remaining default settings as they are, and click Create dataset.
-
bq
To create a new dataset, use the bq mk --dataset
command
.
-
Create a dataset named
bqml_tutorialwith the data location set toUS.bq mk --dataset \ --location=US \ --description "BigQuery ML tutorial dataset." \ bqml_tutorial
-
Confirm that the dataset was created:
bq
ls
API
Call the datasets.insert
method with a defined dataset resource
.
 {

 "datasetReference"
 :

 {

 "datasetId"
 :

 "bqml_tutorial"

 }
 }
Prepare the time-series data
Aggregate the Wikipedia page view data for the Google I/O page into a single table, grouped by day:
-
Go to the BigQuerypage.
-
In the SQL editor pane, run the following SQL statement:
 CREATE

 OR

 REPLACE

 TABLE

 `bqml_tutorial.googleio_page_views`
 AS
 SELECT

 DATETIME_TRUNC
 (
 datehour
 ,

 DAY
 )

 AS

 date
 ,

 SUM
 (
 views
 )

 AS

 views
 FROM

 `bigquery-public-data.wikipedia.pageviews_*`
 WHERE

 datehour

 >=

 '2017-01-01'

 AND

 datehour

 <

 '2023-01-01'

 AND

 title

 =

 'Google_I/O'
 GROUP

 BY

 DATETIME_TRUNC
 (
 datehour
 ,

 DAY
 )
Create a time-series forecasting model that uses built-in holidays
Create a model that forecasts daily page views for the Wikipedia "Google I/O" page, based on page view data before 2022 and taking built-in holidays into account:
-
Go to the BigQuerypage.
-
In the SQL editor pane, run the following SQL statement:
 CREATE

 OR

 REPLACE

 MODEL

 `bqml_tutorial.forecast_googleio`

 OPTIONS

 (

 model_type

 =

 'ARIMA_PLUS'
 ,

 holiday_region

 =

 'US'
 ,

 time_series_timestamp_col

 =

 'date'
 ,

 time_series_data_col

 =

 'views'
 ,

 data_frequency

 =

 'DAILY'
 ,

 horizon

 =

 365
 )
 AS
 SELECT

 *
 FROM

 `bqml_tutorial.googleio_page_views`
 WHERE

 date

 <

 '2022-01-01'
 ;
Visualize the forecasted results
After you create the model using built-in holidays, join the original data from
the bqml_tutorial.googleio_page_views
table with the forecasted value from the ML.EXPLAIN_FORECAST
function
,
and then visualize it by using Data Studio
:
-
Go to the BigQuerypage.
-
In the SQL editor pane, run the following SQL statement:
 SELECT

 original
 .
 date
 ,

 original
 .
 views

 AS

 original_views
 ,

 explain_forecast
 .
 time_series_adjusted_data

 AS

 adjusted_views_without_custom_holiday
 ,
 FROM

 `bqml_tutorial.googleio_page_views`

 original
 INNER

 JOIN

 (

 SELECT

 *

 FROM

 ML
 .
 EXPLAIN_FORECAST
 (

 MODEL

 `bqml_tutorial.forecast_googleio`
 ,

 STRUCT
 (
 365

 AS

 horizon
 ))

 )

 explain_forecast

 ON

 TIMESTAMP
 (
 original
 .
 date
 )

 =

 explain_forecast
 .
 time_series_timestamp
 ORDER

 BY

 original
 .
 date
 ;
-
In the Query resultspane, click Open in > Data Studio. Data Studio opens in a new tab.
-
In the Data Studio tab, click Add a chart, and then click the time series chart:
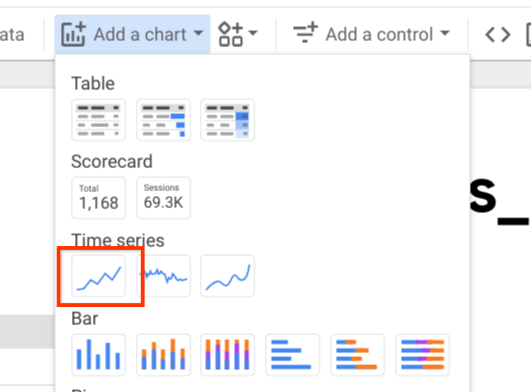
Place the chart on the report.
-
On the Setuptab of the Chartpane, click Add metricand select adjusted_views_without_custom_holiday:
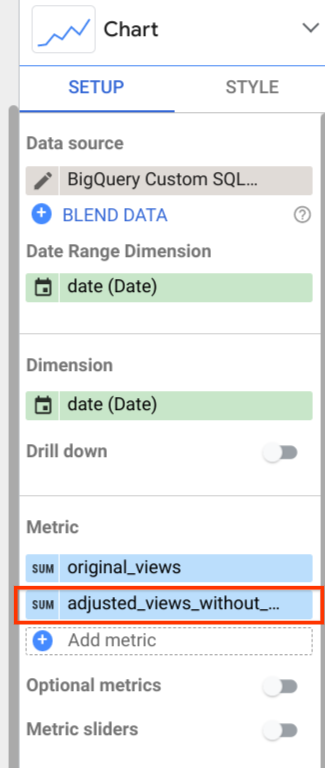
The chart looks similar to the following:
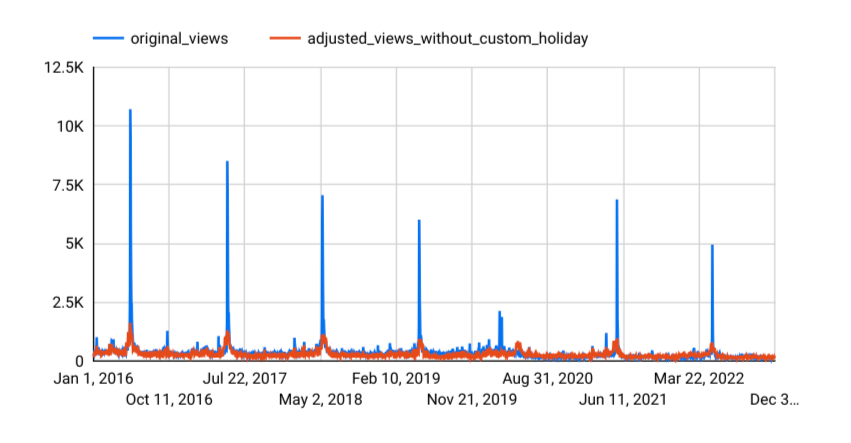
You can see that the forecasting model captures the general trend pretty well. However, it isn't capturing the increased traffic related to previous Google I/O events, and it isn't able to generate an accurate forecast for
- The next sections show you how to deal with some of these limitations.
Create a time-series forecasting model that uses built-in holidays and custom holidays
As you can see in Google I/O history , the Google I/O event occurred on different dates between 2017 and 2022. To take this variation into account, create a model that forecasts page views for the Wikipedia "Google_I/O" page through 2022, based on page view data from before 2022, and using custom holidays to represent the Google I/O event each year. In this model, you also adjust the holiday effect window to cover three days around the event date, to better capture some potential page traffic before and after the event.
-
Go to the BigQuerypage.
-
In the SQL editor pane, run the following SQL statement:
 CREATE

 OR

 REPLACE

 MODEL

 `bqml_tutorial.forecast_googleio_with_custom_holiday`

 OPTIONS

 (

 model_type

 =

 'ARIMA_PLUS'
 ,

 holiday_region

 =

 'US'
 ,

 time_series_timestamp_col

 =

 'date'
 ,

 time_series_data_col

 =

 'views'
 ,

 data_frequency

 =

 'DAILY'
 ,

 horizon

 =

 365
 )
 AS

 (

 training_data

 AS

 (

 SELECT

 *

 FROM

 `bqml_tutorial.googleio_page_views`

 WHERE

 date

 <

 '2022-01-01'

 ),

 custom_holiday

 AS

 (

 SELECT

 'US'

 AS

 region
 ,

 'GoogleIO'

 AS

 holiday_name
 ,

 primary_date
 ,

 1

 AS

 preholiday_days
 ,

 2

 AS

 postholiday_days

 FROM

 UNNEST
 (

 [

 DATE
 (
 '2017-05-17'
 ),

 DATE
 (
 '2018-05-08'
 ),

 DATE
 (
 '2019-05-07'
 ),

 -- cancelled in 2020 due to pandemic

 DATE
 (
 '2021-05-18'
 ),

 DATE
 (
 '2022-05-11'
 )
 ]
 )

 AS

 primary_date

 )
 );
Visualize the forecasted results
After you create the model using custom holidays, join the original data from
the bqml_tutorial.googleio_page_views
table with the forecasted value from the ML.EXPLAIN_FORECAST
function
,
and then visualize it by using Data Studio
:
-
Go to the BigQuerypage.
-
In the SQL editor pane, run the following SQL statement:
 SELECT

 original
 .
 date
 ,

 original
 .
 views

 AS

 original_views
 ,

 explain_forecast
 .
 time_series_adjusted_data

 AS

 adjusted_views_with_custom_holiday
 ,
 FROM

 `bqml_tutorial.googleio_page_views`

 original
 INNER

 JOIN

 (

 SELECT

 *

 FROM

 ML
 .
 EXPLAIN_FORECAST
 (

 MODEL

 `bqml_tutorial.forecast_googleio_with_custom_holiday`
 ,

 STRUCT
 (
 365

 AS

 horizon
 ))

 )

 explain_forecast

 ON

 TIMESTAMP
 (
 original
 .
 date
 )

 =

 explain_forecast
 .
 time_series_timestamp
 ORDER

 BY

 original
 .
 date
 ;
-
In the Query resultspane, click Explore data, and then click Explore with Data Studio. Data Studio opens in a new tab.
-
In the Data Studio tab, click Add a chart, click the time series chart, and place the chart on the report.
-
On the Setuptab of the Chartpane, click Add metricand select adjusted_views_with_custom_holiday.
The chart looks similar to the following:
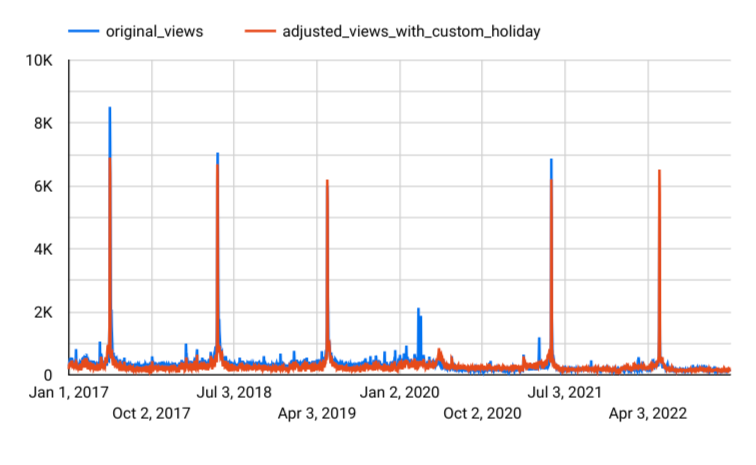
As you can see, the custom holidays boosted the performance of the forecasting model. It now effectively captures the increase of page views caused by Google I/O.
Inspect holiday information
Inspect the list of holidays that were taken into account during modeling
by using the ML.HOLIDAY_INFO
function
:
-
Go to the BigQuerypage.
-
In the SQL editor pane, run the following SQL statement:
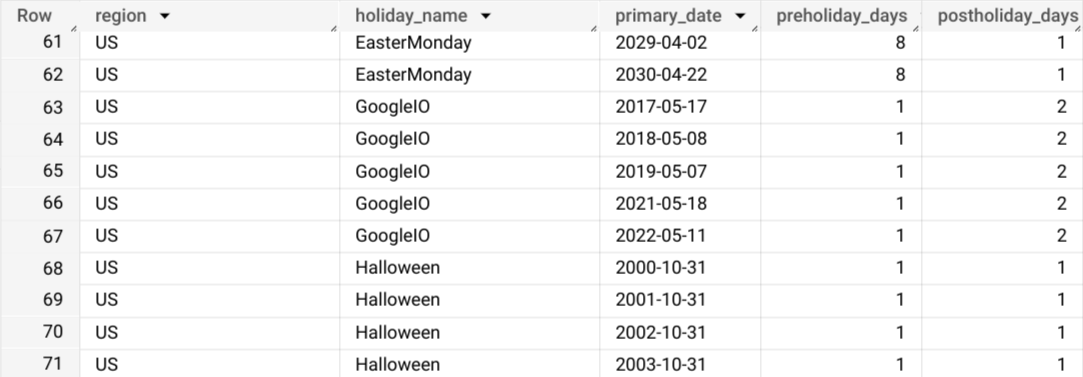
 SELECT

 *
 FROM

 ML
 .
 HOLIDAY_INFO
 (

 MODEL

 `bqml_tutorial.forecast_googleio_with_custom_holiday`
 );
The results show both Google I/O and the built-in holidays in the list of holidays:
Evaluate the effects of the custom holidays
Evaluate the effects of the custom holidays on the forecasted results by
using the ML.EXPLAIN_FORECAST
function
:
-
Go to the BigQuerypage.
-
In the SQL editor pane, run the following SQL statement:
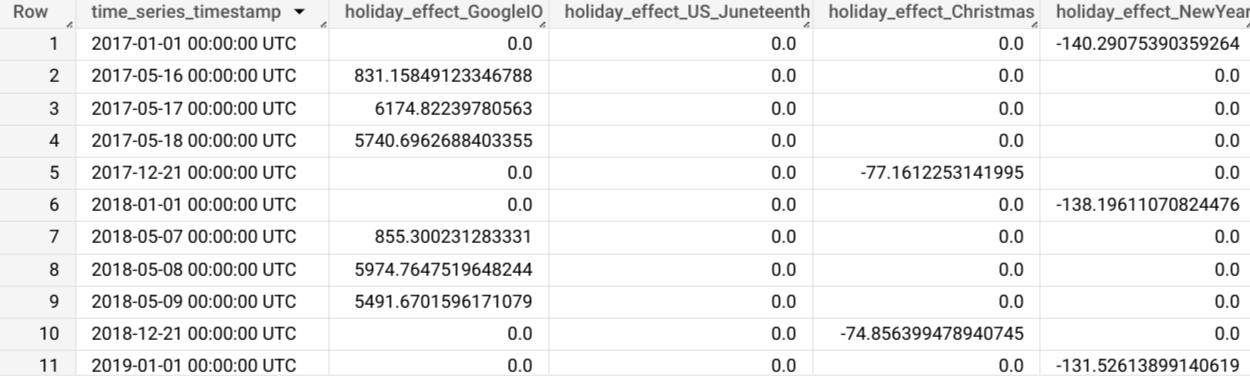
 SELECT

 time_series_timestamp
 ,

 holiday_effect_GoogleIO
 ,

 holiday_effect_US_Juneteenth
 ,

 holiday_effect_Christmas
 ,

 holiday_effect_NewYear
 FROM

 ML
 .
 EXPLAIN_FORECAST
 (

 model

 `bqml_tutorial.forecast_googleio_with_custom_holiday`
 ,

 STRUCT
 (
 365

 AS

 horizon
 ))
 WHERE

 holiday_effect

 !=

 0
 ;
The results show that Google I/O contributes a large amount of holiday effect to the forecasted results:
Compare model performance
Use the ML.EVALUATE
function
to compare the performance of the first model created without custom holidays
and the second model created with custom holidays. To see how the second
model performs when it comes to forecasting a future custom holiday, set the
time range to the week of Google I/O in 2022:
-
Go to the BigQuerypage.
-
In the SQL editor pane, run the following SQL statement:
 SELECT

 "original"

 AS

 model_type
 ,

 *
 FROM

 ml
 .
 evaluate
 (

 MODEL

 `bqml_tutorial.forecast_googleio`
 ,

 (

 SELECT

 *

 FROM

 `bqml_tutorial.googleio_page_views`

 WHERE

 date

 >=

 '2022-05-08'

 AND

 date

 <

 '2022-05-12'

 ),

 STRUCT
 (

 365

 AS

 horizon
 ,

 TRUE

 AS

 perform_aggregation
 ))
 UNION

 ALL
 SELECT

 "with_custom_holiday"

 AS

 model_type
 ,

 *
 FROM

 ml
 .
 evaluate
 (

 MODEL

 `bqml_tutorial.forecast_googleio_with_custom_holiday`
 ,

 (

 SELECT

 *

 FROM

 `bqml_tutorial.googleio_page_views`

 WHERE

 date

 >=

 '2022-05-08'

 AND

 date

 <

 '2022-05-12'

 ),

 STRUCT
 (

 365

 AS

 horizon
 ,

 TRUE

 AS

 perform_aggregation
 ));
The results show that the second model offers a significant performance improvement:

Clean up
- In the Google Cloud console, go to the Manage resources page.
- In the project list, select the project that you want to delete, and then click Delete .
- In the dialog, type the project ID, and then click Shut down to delete the project.