
Page Summary
-
image.reduceNeighborhood()applies a reducer in a sliding window over an image, with the window size and shape defined by anee.Kernel. -
The output of
reduceNeighborhood()is an image where each pixel's value is the result of the reduction in the neighborhood around the corresponding input pixel. -
This technique can be used to quantify landscape differences, such as measuring texture by computing the standard deviation of an index like NDVI within a neighborhood.
Rather than specifying a region over which to perform a reduction, it is also possible
to specify a neighborhood in which to apply a reducer. To reduce image neighborhoods, use image.reduceNeighborhood()
. In this case, the reduction will
occur in a sliding window over the input image, with the window size and shape specified
by an ee.Kernel
. The output of reduceNeighborhood()
will be
another image, with each pixel value representing the output of the reduction in a
neighborhood around that pixel in the input image. Figure 1 illustrates this type of
reduction.
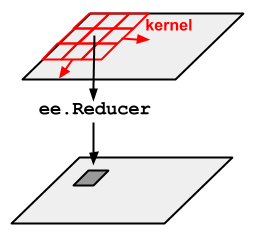
reduceNeighborhood()
, where the reducer
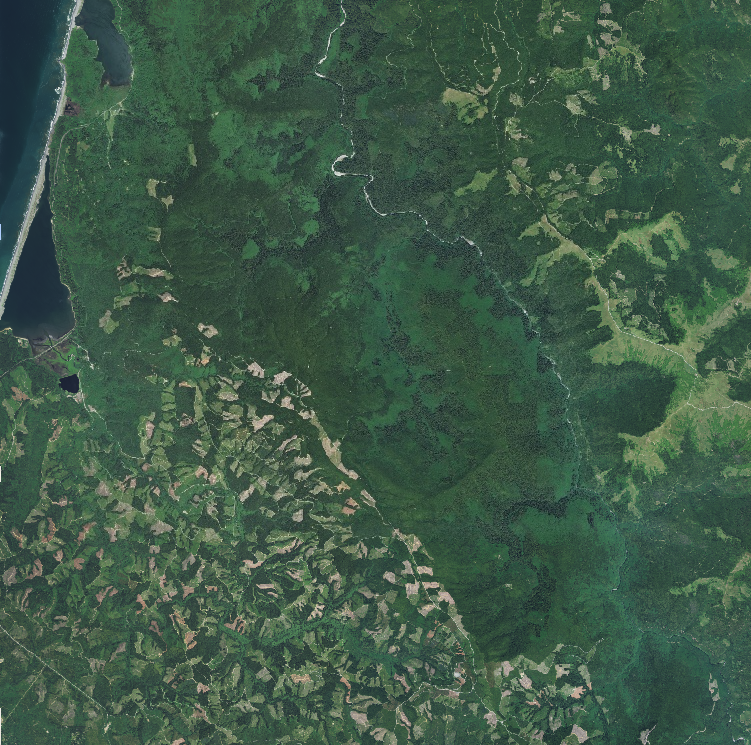
is applied in a kernel.For example, consider using National Agriculture Imagery Program (NAIP) imagery to
quantify landscape differences resulting from logging in the California redwood forests.
Specifically, use standard deviation (SD) in a neighborhood to represent the difference
in texture between the logged area (SW of the image in Figure 2) and the protected area
(NE of the image in Figure 2). For example, to get texture of a NAIP Normalized Difference
Vegetation Index (NDVI) image, use reduceNeighborhood()
to compute SD
in a neighborhood defined by a kernel:
Code Editor (JavaScript)
 // Define a region in the redwood forest.
 var

 redwoods

 =

 ee
 .
 Geometry
 .
 Rectangle
 (
 -
 124.0665
 ,

 41.0739
 ,

 -
 123.934
 ,

 41.2029
 );
 // Load input NAIP imagery and build a mosaic.
 var

 naipCollection

 =

 ee
 .
 ImageCollection
 (
 'USDA/NAIP/DOQQ'
 )

 .
 filterBounds
 (
 redwoods
 )

 .
 filterDate
 (
 '2012-01-01'
 ,

 '2012-12-31'
 );
 var

 naip

 =

 naipCollection
 .
 mosaic
 ();
 // Compute NDVI from the NAIP imagery.
 var

 naipNDVI

 =

 naip
 .
 normalizedDifference
 ([
 'N'
 ,

 'R'
 ]);
 // Compute standard deviation (SD) as texture of the NDVI.
 var

 texture

 =

 naipNDVI
 .
 reduceNeighborhood
 ({

 reducer
 :

 ee
 .
 Reducer
 .
 stdDev
 (),

 kernel
 :

 ee
 .
 Kernel
 .
 circle
 (
 7
 ),
 });
 // Display the results.
 Map
 .
 centerObject
 (
 redwoods
 ,

 12
 );
 Map
 .
 addLayer
 (
 naip
 ,

 {},

 'NAIP input imagery'
 );
 Map
 .
 addLayer
 (
 naipNDVI
 ,

 {
 min
 :

 -
 1
 ,

 max
 :

 1
 ,

 palette
 :

 [
 'FF0000'
 ,

 '00FF00'
 ]},

 'NDVI'
 );
 Map
 .
 addLayer
 (
 texture
 ,

 {
 min
 :

 0
 ,

 max
 :

 0.3
 },

 'SD of NDVI'
 );
 import

 ee
 import

 geemap.core

 as

 geemap
Colab (Python)
 # Define a region in the redwood forest.
 redwoods
 =
 ee
 .
 Geometry
 .
 Rectangle
 (
 -
 124.0665
 ,
 41.0739
 ,
 -
 123.934
 ,
 41.2029
 )
 # Load input NAIP imagery and build a mosaic.
 naip_collection
 =
 (
 ee
 .
 ImageCollection
 (
 'USDA/NAIP/DOQQ'
 )
 .
 filterBounds
 (
 redwoods
 )
 .
 filterDate
 (
 '2012-01-01'
 ,
 '2012-12-31'
 )
 )
 naip
 =
 naip_collection
 .
 mosaic
 ()
 # Compute NDVI from the NAIP imagery.
 naip_ndvi
 =
 naip
 .
 normalizedDifference
 ([
 'N'
 ,
 'R'
 ])
 # Compute standard deviation (SD) as texture of the NDVI.
 texture
 =
 naip_ndvi
 .
 reduceNeighborhood
 (
 reducer
 =
 ee
 .
 Reducer
 .
 stdDev
 (),
 kernel
 =
 ee
 .
 Kernel
 .
 circle
 (
 7
 )
 )
 # Display the results.
 m
 =
 geemap
 .
 Map
 ()
 m
 .
 center_object
 (
 redwoods
 ,
 12
 )
 m
 .
 add_layer
 (
 naip
 ,
 {},
 'NAIP input imagery'
 )
 m
 .
 add_layer
 (
 naip_ndvi
 ,
 {
 'min'
 :
 -
 1
 ,
 'max'
 :
 1
 ,
 'palette'
 :
 [
 'FF0000'
 ,
 '00FF00'
 ]},
 'NDVI'
 )
 m
 .
 add_layer
 (
 texture
 ,
 {
 'min'
 :
 0
 ,
 'max'
 :
 0.3
 },
 'SD of NDVI'
 )
 m
Any pixel with a non-zero kernel value is included in the computation. The kernel
weights are used by default, though you can change that behavior with the inputWeight
argument. The input image and reduceNeighborhood()
output are compared in Figure 2.
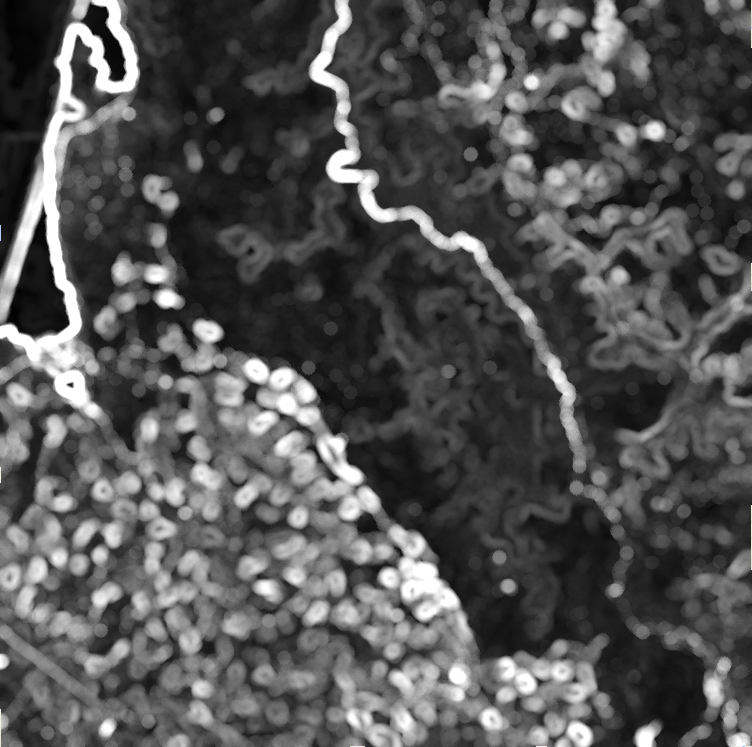
reduceNeighborhood()
output using a standard
deviation reducer.