
PR
令和維新
2004年4月から企業を離れ、コンサルタントや情報起業を試行しなが ら、失われた20年を取り戻し、日本再生をめざす私の歩みをみて一人でも多くの後継者が出てくれることを祈りつつ友達から紹 介されたこのホームページの更新を続け、これまでの活動の記録と今やビッグデータ、AI,、IOT,ブロックチェーン、仮想通貨の時代になってしまいましたが、私の現状認識と関連技術を紹介していきたい。
「政府の出番だよっ!」不確実性への対処
市場を揺るがしている 14 のレイヤー2 暗号資産プロジェクト群(14 Layer 2 Crypto Projects Disrupting the Market)
(2)今週、2つの暗号資産銘柄を分析した — 1つはより安全、もう1つはよりリスクが高い。(I Analyzed Two Crypto Coins This Week — One Safer, One Riskier)
先端技術情報20260513
安全保障は儲からない
技術文書のための拡大可能なコンテンツ分類体系を構築する(Build a Scalable Content Taxonomy for Technical Documentation)
(1)今週、2つの暗号資産銘柄を分析した — 1つはより安全、もう1つはよりリスクが高い。(I Analyzed Two Crypto Coins This Week — One Safer, One Riskier)
先端技術情報20260512
日本と中国の少子化問題
Comments
2026年5月15日の…
 New!
藻緯羅さん
New!
藻緯羅さん源氏物語〔34帖 若菜…
New!
USM1さん急行「きたぐに」青… GKenさん
talking は動名詞、…
samito07さんCategory
カテゴリ未分類
(112)連絡
(24)交流会
(27)セミナー
(29)参考情報
(138)オフ会
(36)on-line報告会
(13)翻訳ビジネス
(8)情報開発
(270)ビッグデータ
(84)ブロックチェーン
(243)人工知能
(488)IOT
(297)仮想通貨
(844)コンテンツ
(123)政治経済
(1871)先端技術
(956)DITA
(50)テレワーク
(28)UX
(0)文書管理
(8)テクニカルライテイング
(17)学習
(9)訓練
(1)XMLソリューション
(3)メタバース
(99)Web3
(66)投資
(180)IoT
(32)投資信託
(1)ビットコイン
(762)イーサリアム
(155)NFT
(41)オンライン
(0)受動収入
(14)ソーシャルメデイア
(0)DAO
(2)DeFi
(74)暗号通貨
(168)トークノミクス
(21)アルトコイン
(223)空中投下
(16)スマート契約
(4)ステーブルコイン
(42)金
(5)生成AI
(5)SCM
(4)ウオレット
(9)不労所得
(57)セキュリテイ
(4)ミームコイン
(50)CBDC
(5)PoS
(3)PoW
(1)ETF
(12)仮想通貨ETF
(1)予言
(7)裁定取引
(1)GameFi
(5)マイニング
(9)RWA
(21)DePIN
(18)SWFT
(1)WLFI
(1)アービトラージ
(7)XRP
(57)大統領選
(4)BCH
(1)取引ボット
(17)トレーデイング
(24)不動産
(1)詐欺
(4)貿易戦争
(1)医療
(1)金融
(2)TEZOS
(1)CARDANO
(2)カルダーノ
(3)ステーキング
(5)チェーンリンク
(1)開発
(0)HEDERA
(1)スマートマネー
(0)流動性
(0)AIエージェント
(8)401k
(1)国際送金
(1)solano
(1)AI
(1)暗号資産
(45)機関投資家
(2)Keyword Search
Freepage List


Shopping List
Lessons Learned from Building It
エンジンを構築することから学んだ教訓
Working on the crypto AI engine taught me a few lessons I hadn’t expected. Lessons that helped me understand the true value of data and leave behind my skepticism for technical analysis:
この仮想通貨向けAIエンジンの開発を通じて、思いがけないいくつかの教訓を私に教えてくれた。 それらは、データの本当の価値を理解し、テクニカル分析への懐疑心を振り切るきっかけにもなった。:
1. Indicators are not absolute truths. Each tells part of the story, and you have to see the pattern in context.
ンジケーターは絶対的な真実ではない。それぞれが物語の一部を語っており、文脈の中でパターンを見なければならない。
2. Consistency beats prediction. Early on, I tried to optimize for “which token would pump next.” That mindset led to overfitting. The engine works best when it’s about understanding the market state, not guessing the future.
一貫性は予測に勝る。初期の頃、私は「次にどのトークンが急騰するか」を最適化しようとしていた。その考え方は過剰適合につながった。このエンジンは、未来を予測するのではなく、市場の状態を理解することに使うと最もよく機能する。
3. Explainability is key. I had to make every calculation transparent. Users need to see the numbers behind the charts. Otherwise, it feels like magic, and people stop trusting it.
説明可能性が鍵だ。私はすべての計算を透明にしなければならなかった。ユーザーはチャートの背後にある数字を見る必要がある。そうでなければ、それは魔法のように感じられて、人々はそれを信頼しなくなる。
4. Automation exposes nuances. Running hundreds of tokens through the same system revealed patterns I would never have noticed manually. For example, volatility spikes often preceded reversals even when RSI didn’t flag anything.
自動化は微妙な違いを明らかにする。何百ものトークンを同じシステムで処理することで、手作業では決して気づかなかったパターンが明らかになった。たとえば、RSIが何も示していなくても、乱高下の急上昇が反転の前兆になることがよくあった。

Applying Technical Analysis Daily
テクニカル分析を日々活用する
This is the part you’re probably here for: how exactly do you use Pump Parade’s AI technical analysis for crypto trading?
おそらく、あなたがここに来た目的はこの部分でしょう:Pump Parade のAIテクニカル分析を仮想通貨トレードにどうやって正確に使うのか。
Don’t worry, it’s extremely easy, but I felt I had to explain how it works so you understand what you’re seeing when you use it. Now that we’ve covered that, let’s jump in.
心配しないで、とても簡単です。でも、使うときに何を見ているのかを理解してもらうために、その仕組みを説明する必要があると感じました。 では、それを踏まえて、さっそく始めましょう。
Step 1: Select Your Token
ステップ1:トークンを選ぶ
Start by choosing the token you want to analyze. Pump Parade supports over 1,000 tokens, each of them packed with data pulled from the blockchain.
まず、分析したいトークンを選びましょう。Pump Parade は1,000以上のトークンに対応しており、それぞれにブロックチェーンから取得したデータが詰まっています。
Once selected, the system automatically fetches historical price and volume data. Behind the scenes, it calculates all the core indicators:
トークンを選択すると、システムが自動的に過去の価格と出来高データを取得します。その裏側では、以下の主要なインジケーターが計算されます:
- RSI (Relative Strength Index)
for momentum
RSI (相対力指数):勢いの測定 - 20-day Moving Average (MA)
for trend smoothing
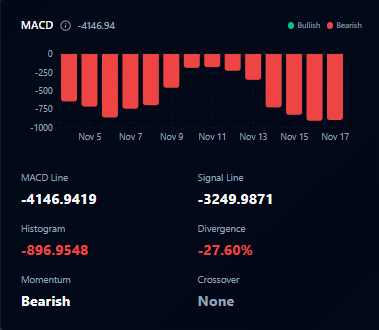
20 日移動平均線( MA ):トレンドの平滑化 - MACD (Moving Average Convergence Divergence) for trend />
- Linear Regression Slope
for trend strength
線形回帰の傾き:トレンドの強さ - Volatility
to understand risk
乱高下:リスクの把握 - Support and Resistance Levels
for realistic price boundaries
サポートとレジスタンス:現実的な価格の上下限

Step 2: Understand the Dashboard Layout
ステップ
2
:ダッシュボードのレイアウトを理解する
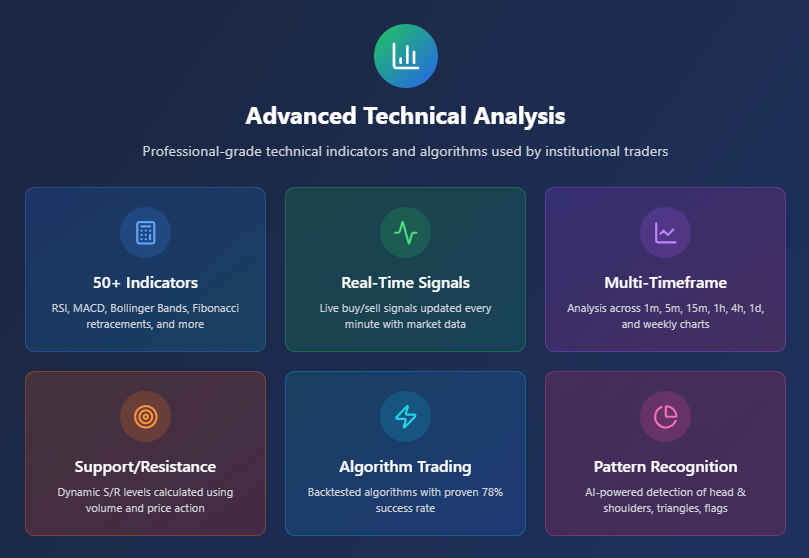
Pump Parade organizes technical indicators in a way that’s easy to digest at a glance:
Pump Parade
は、テクニカル指標を一目で把握しやすい形で整理します:
- Trend Metrics
: Shows the current direction, slope, and momentum.
トレンド指標 :現在の方向性、傾き、勢いを表示 - RSI
: Highlighted with color coding: oversold in green (-30), overbought (+70) in red.
RSI :色分けで表示。売られすぎ( -30 )は緑、買われすぎ( +70 )は赤 - Moving Averages
: Plotted over the price chart, showing trend smoothing.
移動平均線 :価格チャート上に重ねて表示され、トレンドを平滑化 - MACD and Signal Lines
: Histogram indicates momentum strength.
MACD とシグナルライン: ヒストグラムで勢いの強さを示す - Volatility Indicator
: Visualized as a shading layer or chart overlay.
ボラティリティ指標 :シェーディングやチャートのオーバーレイで視覚化 - Support & Resistance Bands
: Highlight likely breakout or bounce zones.
サポート&レジスタンス帯 :突破や反発が起こりやすいゾーンを強調
All these are presented in a visually engaging, clear way, with tool tips that explain each chart in case you don’t fully understand what you’re looking at.
これらすべてが視覚的にわかりやすく表示されており、各チャートにはツールチップが付いていて、見ている内容が完全に理解できなくても説明が表示されます。

Spending a minute reviewing the dashboard before any decision allows you to spot patterns quickly, without diving into raw numbers.
意思決定の前に
1
分間ダッシュボードを見直すことで、生の数字に深く入り込まなくても、すばやくパターンを見つけることができます。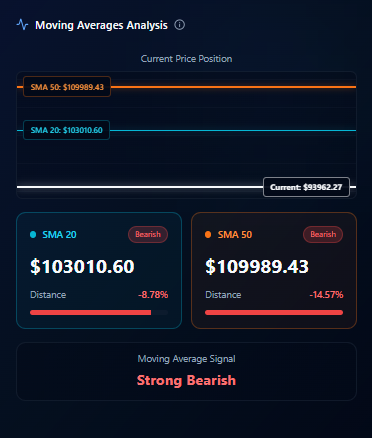

Step 3: Make Data-Driven Decisions
ステップ
3
:データに基づいた意思決定を行う
Once all indicators are visible and aligned, I make decisions based on context, not gut feeling
:
すべてのインジケーターが表示され、整ったら、私は直感ではなく文脈に基づいて判断を下す。:
- Bullish trend + low RSI → strong potential buy
上昇トレンド + 低い RSI → 強い潜在的買い - High volatility near resistance → cautious approach
大きな乱高下 + レジスタンス付近 → 慎重なアプローチ
Pump Parade
’s dashboard makes these assessments intuitive. The visualizations and overlays reduce guesswork, letting you focus on interpreting signals instead of hunting for data.
Pump Parade
のダッシュボードは、こうした判断を直感的に行えるように設計されています。
視覚化や重ね合わせによって、データを探し回る必要がなくなり、シグナルの解釈に集中できます。
==============================
インターネット・コンピュータランキング
==============================
ネットサービスランキング
![[商品価格に関しましては、リンクが作成された時点と現時点で情報が変更されている場合がございます。]](https://hbb.afl.rakuten.co.jp/hgb/4f090f21.289310e1.4f090f23.6f4d2551/?me_id=1220528&item_id=10000332&pc=https%3A%2F%2Fthumbnail.image.rakuten.co.jp%2F%400_mall%2Fomosan%2Fcabinet%2F11749111%2Fomotenashi%2Fomotenashi.jpg%3F_ex%3D240x240&s=240x240&t=picttext "[商品価格に関しましては、リンクが作成された時点と現時点で情報が変更されている場合がございます。]")
\SS期間ポイント5倍※要エントリー★さらに12/10限定+5倍/おせち 2026 予約 千賀屋謹製 『おもてなし』 和風 3段重 57品 4人前 5人前 8.5寸 送料無料 お節 千賀屋 御節 おせち料理 2025 お正月 御節料理 三段重
価格:16,900円(税込、送料無料) (2025/12/9時点)

![[商品価格に関しましては、リンクが作成された時点と現時点で情報が変更されている場合がございます。]](https://hbb.afl.rakuten.co.jp/hgb/1ff2bb79.191d27ac.1ff2bb7a.979bba0e/?me_id=1206032&item_id=14577484&pc=https%3A%2F%2Fthumbnail.image.rakuten.co.jp%2F%400_mall%2Fjism%2Fcabinet%2F0528%2F4529327929000.jpg%3F_ex%3D240x240&s=240x240&t=picttext "[商品価格に関しましては、リンクが作成された時点と現時点で情報が変更されている場合がございます。]")
Titan Army|タイタンアーミー ゲーミング液晶ディスプレイ(27型/FAST IPS/WQHD 2560×1440/320Hz/1ms/HDR1000/HDMI2.1/DP1.4/PBP・PIP対応/VESA)(ブラック) P275MS+
価格:62,800円(税込、送料別) (2025/8/1時点)
![[商品価格に関しましては、リンクが作成された時点と現時点で情報が変更されている場合がございます。]](https://hbb.afl.rakuten.co.jp/hgb/4ae27d5e.21a3ae23.4ae27d5f.b3ad3ffe/?me_id=1430642&item_id=10000096&pc=https%3A%2F%2Fthumbnail.image.rakuten.co.jp%2F%400_mall%2Fvoguevortex%2Fcabinet%2F11366713%2F11366934%2F11367029%2Fztr.jpg%3F_ex%3D240x240&s=240x240&t=picttext "[商品価格に関しましては、リンクが作成された時点と現時点で情報が変更されている場合がございます。]")
![[商品価格に関しましては、リンクが作成された時点と現時点で情報が変更されている場合がございます。]](https://hbb.afl.rakuten.co.jp/hgb/4ae27bcc.ba8aeb41.4ae27bcd.9a8f4b71/?me_id=1425036&item_id=10000049&pc=https%3A%2F%2Fthumbnail.image.rakuten.co.jp%2F%400_mall%2Fgmktecdirect%2Fcabinet%2F10269465%2Fcoupon%2Fk8plus-samune-0331.jpg%3F_ex%3D240x240&s=240x240&t=picttext "[商品価格に関しましては、リンクが作成された時点と現時点で情報が変更されている場合がございます。]")
![[商品価格に関しましては、リンクが作成された時点と現時点で情報が変更されている場合がございます。]](https://hbb.afl.rakuten.co.jp/hgb/4ae27418.1ee40ea5.4ae27419.d4988bf9/?me_id=1413163&item_id=10000379&pc=https%3A%2F%2Fthumbnail.image.rakuten.co.jp%2F%400_mall%2Fexception5251%2Fcabinet%2F11219683%2F11219688%2Fdiscount75%2Ff-00003.jpg%3F_ex%3D240x240&s=240x240&t=picttext "[商品価格に関しましては、リンクが作成された時点と現時点で情報が変更されている場合がございます。]")
![[商品価格に関しましては、リンクが作成された時点と現時点で情報が変更されている場合がございます。]](https://hbb.afl.rakuten.co.jp/hgb/49d5faeb.86973ea4.49d5faec.1dd8f601/?me_id=1427535&item_id=10000020&pc=https%3A%2F%2Fthumbnail.image.rakuten.co.jp%2F%400_mall%2Flakshmistore%2Fcabinet%2F10865184%2Fimgrc0088556619.jpg%3F_ex%3D240x240&s=240x240&t=picttext "[商品価格に関しましては、リンクが作成された時点と現時点で情報が変更されている場合がございます。]")
![[商品価格に関しましては、リンクが作成された時点と現時点で情報が変更されている場合がございます。]](https://hbb.afl.rakuten.co.jp/hgb/3c5b7654.02273dfa.3c5b7655.0ebf4fa0/?me_id=1396705&item_id=10001358&pc=https%3A%2F%2Fthumbnail.image.rakuten.co.jp%2F%400_mall%2Fkrdirect%2Fcabinet%2Fnewpc%2Fn150_01_256g_rd.jpg%3F_ex%3D240x240&s=240x240&t=picttext "[商品価格に関しましては、リンクが作成された時点と現時点で情報が変更されている場合がございます。]")
![[商品価格に関しましては、リンクが作成された時点と現時点で情報が変更されている場合がございます。]](https://hbb.afl.rakuten.co.jp/hgb/4cb237fd.80b5f2c4.4cb237fe.9a40616a/?me_id=1360411&item_id=10000102&pc=https%3A%2F%2Fthumbnail.image.rakuten.co.jp%2F%400_mall%2Ff464686-osaki%2Fcabinet%2F08433205%2Fimgrc0109948245.jpg%3F_ex%3D240x240&s=240x240&t=picttext "[商品価格に関しましては、リンクが作成された時点と現時点で情報が変更されている場合がございます。]")
![[商品価格に関しましては、リンクが作成された時点と現時点で情報が変更されている場合がございます。]](https://hbb.afl.rakuten.co.jp/hgb/48b50de1.c719ad98.48b50de2.1452644e/?me_id=1306273&item_id=10024122&pc=https%3A%2F%2Fthumbnail.image.rakuten.co.jp%2F%400_mall%2Fsoukaidrink%2Fcabinet%2F920%2F4901777440920.jpg%3F_ex%3D240x240&s=240x240&t=picttext "[商品価格に関しましては、リンクが作成された時点と現時点で情報が変更されている場合がございます。]")
![[商品価格に関しましては、リンクが作成された時点と現時点で情報が変更されている場合がございます。]](https://hbb.afl.rakuten.co.jp/hgb/48b50a19.a272b4b8.48b50a1a.581db4e0/?me_id=1433141&item_id=10000025&pc=https%3A%2F%2Fthumbnail.image.rakuten.co.jp%2F%400_mall%2Fhappynext%2Fcabinet%2F12002380%2Fimgrc0104829129.jpg%3F_ex%3D240x240&s=240x240&t=picttext "[商品価格に関しましては、リンクが作成された時点と現時点で情報が変更されている場合がございます。]")
-
彼は数分で 6 BTC を失った — Apple のス… 2026.05.02
-
もし、あなたが今週読んだすべての暗号資… 2026.04.24
-
先端技術情報20260421 2026.04.21


