全1041件 (1041件中 301-350件目)
< 1 2 3 4 5 6 7 8 9 10 11 12 ... 21 >
-

◆【新型コロナ】動くグラフ:米国の州別の死亡者数の累計の推移です:ニューヨーク、テキサス、カリフォルニア、フロリダで特に多いことがわかります
米国の州別の死亡者数の累計の動くグラフです。ジョンズ・ホプキンス大学の公表データを利用しています。第1波の時に、ニューヨーク州で死亡者が非常に多かったことがわかります。↓アニメーションGIFです。画像ファイルの一種です。感染確認者数の累計と同様に、テキサス、カリフォルニア、フロリダで増えていることがわかります。-------------------------------------------------------------------------------------------------------------------------------------------------------------楽天市場で「マスク」を検索する楽天市場で「ポビドンヨード」を検索する楽天市場で「イソジン うがい薬」を探す楽天市場で「うがい薬」を検索する楽天市場で「マウスウォッシュ・洗口液」を探す-----------------------------------------------------------------------楽天市場で「フコイダン」を探す-----------------------------------------------------------------------AQUOS sense3 lite+Rakuten UN-LIMITプランセット(事務手数料3300円込)【22000円相当のポイント還元】価格:31280円(税別、送料別)(2020/7/15時点)楽天で購入ついに、AQUOS sense3 liteも高額ポイントの対象になりました。マイナンバーカードの読み取りに対応している機種です。----------------------------------------------------------------------------------Galaxy A7+Rakuten UN-LIMITプランセット(事務手数料3300円込)【15000円相当のポイント還元】価格:22000円(税込、送料無料) (2020/5/31時点)楽天で購入↑楽天市場店で購入すればよかったと思います:アマゾン・プライム・ビデオはHD 1080Pで視聴できます:有機ELなので、黒がきれいです:ヘッドホンでのドルビーアトモスに対応しています。-------------------------------------------------------------------------↓楽天市場以外の有名ストアの利用でも楽天ポイントが貯まります。----------------------------------------------------------------------------------------------------------------------------------------------------------------------------------------------------------------【ダッシュボード「COVID-19 Transition Graphs」を試作】こちらは、ジョンズ・ホプキンス大学のデータを利用したダッシュボードです。中国本土以外の地域への感染が拡大しているため、国別、地域別の感染者数の推移を簡単に確認できるダッシュボードを試作しています。随時、ページを追加しています。グラフのデータは、右上部分の操作でダウンロードすることができます。アメリカの「地域別の変数」を前処理して、「州別」での推移をグラフ化できるようにしました。また、州コードのフィールドを作成してコロプレス地図も作成しています。楽天ブログでは「iframe」タグが使えないので、Bloggerのページから利用できるようにしています。無料で利用できる、グーグルの「データポータル」のダッシュボードです。データさえあれば、簡単に作成できます。「国」別、「地域」別に日ごとの感染者数の推移を見ることができます。↓ダッシュボードの試作です。下記リンクのページから利用できます。ジョンズ・ホプキンス大学の「JHU CSSE」の「Covid19 Daily Reports」のデータを利用しています。 EdgeブラウザやIEブラウザなど、Chromeブラウザ以外での利用の場合はうまく表示されないことがあるようです。↓上記のダッシュボードのデータの出所のサイトです。マップがメインのダッシュボードです-----------------------------------------------------------------------------------------↓日本のインフルエンザの「定点当たり報告数」をグラフ化できるダッシュボードを試作。都道府県別にグラフ化可能です。--------------------------------------------------------------------------★おすすめの記事 ◆How Windows Sonic looks like.:Windows Sonic for Headphonesの音声と2chステレオ音声の比較:7.1.2chテストトーンの比較で明らかになった違い:一目で違いがわかりました----------------------------------------------------------------------------------------------------------
2020.11.03
コメント(0)
-

◆【新型コロナ】動くグラフ:米国の州別の感染確認者数の累計の推移です:7月頃からカリフォルニア、テキサス、フロリダで増えたことがわかります
米国の大統領選挙直前ということで、久しぶりに、米国の州別の感染確認者数の累計の推移がわかる、動くグラフを更新してみました。ジョンズ・ホプキンス大学の公表データを利用しています。↓アニメーションGIFです。画像ファイルの一種です。上位の20州が表示されるようにしていますが、20州の推移を静止画の折れ線グラフで表現すると、どの線がどの州なのかわからなくなりますが、この動くグラフだとわかりやすいので、それなりの意義はありそうです。最近は、カリフォルニア、テキサス、フロリダが1~3位で動かなくなっています。新型コロナが米大統領選挙の投票行動にどれだけの影響を与えているのか不明ですが、もし影響度が大きいとすると、テキサスやフロリダでトランプ氏の勝利は難しくなっているということになるのでしょうか。米国大統領選挙は、期日前投票や郵便投票で、すでに結果が決まってしまっているのかもしれませんが。-------------------------------------------------------------------------------------------------------------------------------------------------------------楽天市場で「マスク」を検索する楽天市場で「ポビドンヨード」を検索する楽天市場で「イソジン うがい薬」を探す楽天市場で「うがい薬」を検索する楽天市場で「マウスウォッシュ・洗口液」を探す-----------------------------------------------------------------------楽天市場で「フコイダン」を探す-----------------------------------------------------------------------AQUOS sense3 lite+Rakuten UN-LIMITプランセット(事務手数料3300円込)【22000円相当のポイント還元】価格:31280円(税別、送料別)(2020/7/15時点)楽天で購入ついに、AQUOS sense3 liteも高額ポイントの対象になりました。マイナンバーカードの読み取りに対応している機種です。----------------------------------------------------------------------------------Galaxy A7+Rakuten UN-LIMITプランセット(事務手数料3300円込)【15000円相当のポイント還元】価格:22000円(税込、送料無料) (2020/5/31時点)楽天で購入↑楽天市場店で購入すればよかったと思います:アマゾン・プライム・ビデオはHD 1080Pで視聴できます:有機ELなので、黒がきれいです:ヘッドホンでのドルビーアトモスに対応しています。-------------------------------------------------------------------------↓楽天市場以外の有名ストアの利用でも楽天ポイントが貯まります。----------------------------------------------------------------------------------------------------------------------------------------------------------------------------------------------------------------【ダッシュボード「COVID-19 Transition Graphs」を試作】こちらは、ジョンズ・ホプキンス大学のデータを利用したダッシュボードです。中国本土以外の地域への感染が拡大しているため、国別、地域別の感染者数の推移を簡単に確認できるダッシュボードを試作しています。随時、ページを追加しています。グラフのデータは、右上部分の操作でダウンロードすることができます。アメリカの「地域別の変数」を前処理して、「州別」での推移をグラフ化できるようにしました。また、州コードのフィールドを作成してコロプレス地図も作成しています。楽天ブログでは「iframe」タグが使えないので、Bloggerのページから利用できるようにしています。無料で利用できる、グーグルの「データポータル」のダッシュボードです。データさえあれば、簡単に作成できます。「国」別、「地域」別に日ごとの感染者数の推移を見ることができます。↓ダッシュボードの試作です。下記リンクのページから利用できます。ジョンズ・ホプキンス大学の「JHU CSSE」の「Covid19 Daily Reports」のデータを利用しています。 EdgeブラウザやIEブラウザなど、Chromeブラウザ以外での利用の場合はうまく表示されないことがあるようです。↓上記のダッシュボードのデータの出所のサイトです。マップがメインのダッシュボードです-----------------------------------------------------------------------------------------↓日本のインフルエンザの「定点当たり報告数」をグラフ化できるダッシュボードを試作。都道府県別にグラフ化可能です。--------------------------------------------------------------------------★おすすめの記事 ◆How Windows Sonic looks like.:Windows Sonic for Headphonesの音声と2chステレオ音声の比較:7.1.2chテストトーンの比較で明らかになった違い:一目で違いがわかりました----------------------------------------------------------------------------------------------------------
2020.11.03
コメント(0)
-

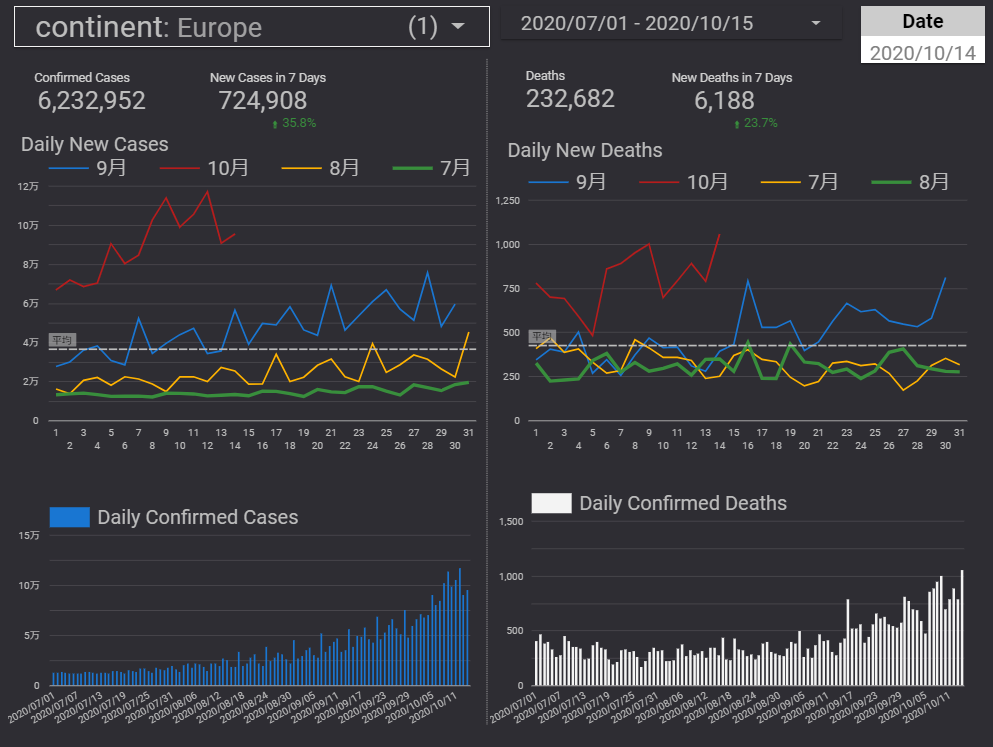
◆【新型コロナ】ヨーロッパの1週間の死亡者数は、47%の増加:10月下旬の推移は3月下旬の推移と同じペースになっています
ヨーロッパでは、感染確認者数が増加していますが、死亡者数も増加しています。直近の7日間の死亡者数は、前の7日間と比べて47%増加しています。グラフを見ると、10月の死亡者数の増加パターンは3月の時のパターンと重なりました。3月の時と同じペースで死亡者数が増加しています。↓右上のグラフは横軸が日で、各折れ線が月別の死亡者数の推移を表しています。3月下旬の折れ線と10月下旬の折れ線がほぼ重なっています。ということは、第1波と同じくらいの死亡者数になる可能性があるのかもしれません。日本も北海道で感染確認者数が増えていますが、北海道はヨーロッパと緯度が同じくらいなので、冬の到来によって感染確認者数が増加している、ということでしょうか。-------------------------------------------------------------------------------------------------------------------------------------------------------------楽天市場で「マスク」を検索する楽天市場で「ポビドンヨード」を検索する楽天市場で「イソジン うがい薬」を探す楽天市場で「うがい薬」を検索する楽天市場で「マウスウォッシュ・洗口液」を探す-----------------------------------------------------------------------楽天市場で「フコイダン」を探す-----------------------------------------------------------------------AQUOS sense3 lite+Rakuten UN-LIMITプランセット(事務手数料3300円込)【22000円相当のポイント還元】価格:31280円(税別、送料別)(2020/7/15時点)楽天で購入ついに、AQUOS sense3 liteも高額ポイントの対象になりました。マイナンバーカードの読み取りに対応している機種です。----------------------------------------------------------------------------------Galaxy A7+Rakuten UN-LIMITプランセット(事務手数料3300円込)【15000円相当のポイント還元】価格:22000円(税込、送料無料) (2020/5/31時点)楽天で購入↑楽天市場店で購入すればよかったと思います:アマゾン・プライム・ビデオはHD 1080Pで視聴できます:有機ELなので、黒がきれいです:ヘッドホンでのドルビーアトモスに対応しています。-------------------------------------------------------------------------↓楽天市場以外の有名ストアの利用でも楽天ポイントが貯まります。----------------------------------------------------------------------------------------------------------------------------------------------------------------------------------------------------------------【ダッシュボード「COVID-19 Transition Graphs」を試作】こちらは、ジョンズ・ホプキンス大学のデータを利用したダッシュボードです。中国本土以外の地域への感染が拡大しているため、国別、地域別の感染者数の推移を簡単に確認できるダッシュボードを試作しています。随時、ページを追加しています。グラフのデータは、右上部分の操作でダウンロードすることができます。アメリカの「地域別の変数」を前処理して、「州別」での推移をグラフ化できるようにしました。また、州コードのフィールドを作成してコロプレス地図も作成しています。楽天ブログでは「iframe」タグが使えないので、Bloggerのページから利用できるようにしています。無料で利用できる、グーグルの「データポータル」のダッシュボードです。データさえあれば、簡単に作成できます。「国」別、「地域」別に日ごとの感染者数の推移を見ることができます。↓ダッシュボードの試作です。下記リンクのページから利用できます。ジョンズ・ホプキンス大学の「JHU CSSE」の「Covid19 Daily Reports」のデータを利用しています。 EdgeブラウザやIEブラウザなど、Chromeブラウザ以外での利用の場合はうまく表示されないことがあるようです。↓上記のダッシュボードのデータの出所のサイトです。マップがメインのダッシュボードです-----------------------------------------------------------------------------------------↓日本のインフルエンザの「定点当たり報告数」をグラフ化できるダッシュボードを試作。都道府県別にグラフ化可能です。--------------------------------------------------------------------------★おすすめの記事 ◆How Windows Sonic looks like.:Windows Sonic for Headphonesの音声と2chステレオ音声の比較:7.1.2chテストトーンの比較で明らかになった違い:一目で違いがわかりました----------------------------------------------------------------------------------------------------------
2020.11.02
コメント(0)
-

◆【省エネ暖房とは?】そろそろ、暖房の用意をしたいと思います
そろそろ、朝晩の冷え込みがきつくなってきました。そろそろ、パネルヒーターを出して使おうと思います。最近、利用しているパネルヒーターは、日本遠赤外線という会社の「サンルミエ」というものです。日本遠赤外線株式会社 遠赤外線ヒーターサンルミエ・エクセラ7 ゴールドメタリック 最大700w 4580407552723価格:43978円(税別、送料別)(2020/11/2時点)楽天で購入消費電力が少ないですが、遠赤外線でしっかりと暖まりますこのパネルヒーターは、セラミックのパネルを電気で熱して遠赤外線を放出するという仕組みのようです。いわゆる遠赤外線の輻射による暖房というものです。電気を使う暖房器具で最も省エネなのは、エアコンだそうですが、パネルヒーターの輻射熱は、エアコンやファンヒーターとは、暖かさの質が異なります。そもそも、暖房器具が暖かいのは、熱を伝えてくれるからですが、エアコンとかファンヒーターは、空気を暖めて、暖めた空気を部屋の中で対流させる仕組みです。最近の電気ストーブのカーボンヒーター、グラファイトヒーター、シーズヒーターとかは、石英管ヒーターが進化したものでしょうか。カーボンヒーターは、カーボンを電気で熱して遠赤外線を発生させる仕組みのようです。電流によってカーボンヒーターが発熱しますが、発生した熱を利用して暖房をしようというものではなく、あくまでも遠赤外線を放出させるためにカーボンを熱しているようです。そうでなければ、「カーボン」を熱する必要はなく、別の素材を熱してもいいはずです。そういえば、セラミックファンヒーターとかは、発熱させたセラミックの熱を温風にして利用しています。カーボンヒーターにおいて、発熱の「熱」による「暖かさ」と、放出された遠赤外線による「暖かさ」の割合がどのくらいなのか知りたいところではあります。なお、遠赤外線を多く放出する素材は、セラミックとかカーボン(炭素)ということらしいです。グラファイトも炭素系の素材です。カーボンが高温にならなくても遠赤外線が発生すればいいのですが、高温にならないと遠赤外線が多く発生しないので仕方がありません。「全放射エネルギー量は、黒体の絶対温度の4乗に比例する」というシュテファン・ボルツマンの法則があるそうで、温度を高くしないと、放射されるエネルギー量は増えないようです。グラファイトヒーターとかは、アラジンのオーブントースターにも使われていますが、原理的に、電気ストーブは、大きめのトースターということになるようです。グラフファイトヒーターを利用した電気ストーブは、パンを焼く代わりに、遠赤外線で人間を暖めていることになります。ところで、遠赤外線(光、電磁波の一種)は、太陽の光にも含まれていて、日なたが暖かいのは遠赤外線の力によるものです。太陽の「熱」が直接地表に届いている訳ではありません。真空の宇宙空間では「熱」が伝導しないからです。日なたが暖かいのは、太陽からの遠赤外線によって、からだの分子が振動して暖まるという仕組みのようです。水の分子を振動させる、電子レンジの仕組みとも似ているようです。ということは、電気ストーブは、ミクロの人工太陽のようなものということになるのでしょうか。真夏に建物や地面が熱くなるのも遠赤外線によるものです。遠赤外線は、人のからだだけでなく、天井、床、壁、部屋の中の家具なども暖めます。カーボンヒーターから多くの遠赤外線が放出されるということは、カーボン(炭素)を含む木の床や木製家具、プラスティック製品など、いわゆる有機物は遠赤外線を多く吸収するということになります。ただし、遠赤外線は物体の表面で吸収されて、物体の奥深くまで浸透するわけではないようです。「遠赤外線でからだの芯からあたたまる」という表現がありますが、正確には、「遠赤外線によってからだの表面の分子が振動してあたたまり、その熱がからだの内部に伝わっている」ということのようです。確かに、アラジンのグラファイトグリラーという遠赤外線ロースターは焼肉の焼き時間が長いそうですが、遠赤外線が内部まで浸透するのであれば、すぐ焼きあがるはずなのに、そうではなく時間がかかるというのは、表面が発熱し、その熱が内部に伝わって焼きあがる、ということなのかもしれません。さて、使用しているパネルヒーターのサンルミエは、セラミックパネルを熱しているのですが、それほど高温にならないので、ちょっとふれてもやけどをするようなことはありません。ハロゲンヒーターや石英管ヒーターなどを使った電気ストーブと比べると安全性は高いと思います。最近、カーボンヒーターやグラファイトヒーターにとって代わられた感のあるハロゲンヒーターは、非常に高温になるので、使用する際には注意が必要です。もちろん、その発熱も暖かさとして感じているのでしょうが、できれば、高温にならずに遠赤外線だけを出すヒーターが望まれます。高温にならなくても、多くの遠赤外線を放出するヒーターが、安全性が高くていいのではないかと思います。石英管ヒーターやハロゲンヒーター、カーボンヒーターなどの表面温度は数百度になるので、布団や座布団と接したりして火災が起きる事例が多いようです。石油ストーブを就寝時につけたままにするのと同じで、就寝時のつけっぱなしは非常に危険です。電気ストーブは、「火を使わないので、安全だ」という思い込みがあるようです。しかし、寒冷地では、石油ストーブが冬の火災原因の1位だったりしますが、石油ストーブを使わないような地域での冬の火災原因として、電気ストーブが1位だったりするようです。電気ストーブは価格が安いものも多く、広く普及しているという背景もあるのだと考えられます。一方、サンルミエは、布団などとの距離が十分あれば、就寝時につけていても問題ありません。設置する場所は、カーテンにふれないように気をつける必要がありますが、窓からの冷気によって足元が冷え込むコールドドラフト現象を防ぐという意味で、窓際に置くのがいいようです。ということで、セラミックパネルヒーターの「サンルミエ」を愛用しています。でも、遠赤外線は目に見えないので、電気ストーブのようなオレンジ色にはならない点が物足りないのは確かです。暖炉の映像付きの電気ストーブではありませんが、炎を連想させるオレンジ色の光には「あったかいよ!」というデモンストレーションの効果があるのは確かです。いわゆる「暖色効果」というものでしょうか。しかし、「サンルミエ」のパネルはあまり高温にならないので、子どもやペットが近くにいても安心です。カーボンヒーターなどよりも本体の価格が割高ですが、消費電力の少なさと安全性で元がとれるのではないかと考えています。最大の出力は700Wですが、「弱」だと325Wです、「弱」で使う時間を長くすれば、結構、省エネなのではないかと思います。-------------------------------------------------------------------------------------------------------------------------------------------------------------楽天市場で「マスク」を検索する楽天市場で「ポビドンヨード」を検索する楽天市場で「イソジン うがい薬」を探す楽天市場で「うがい薬」を検索する楽天市場で「マウスウォッシュ・洗口液」を探す-----------------------------------------------------------------------楽天市場で「フコイダン」を探す-----------------------------------------------------------------------AQUOS sense3 lite+Rakuten UN-LIMITプランセット(事務手数料3300円込)【22000円相当のポイント還元】価格:31280円(税別、送料別)(2020/7/15時点)楽天で購入ついに、AQUOS sense3 liteも高額ポイントの対象になりました。マイナンバーカードの読み取りに対応している機種です。----------------------------------------------------------------------------------Galaxy A7+Rakuten UN-LIMITプランセット(事務手数料3300円込)【15000円相当のポイント還元】価格:22000円(税込、送料無料) (2020/5/31時点)楽天で購入↑楽天市場店で購入すればよかったと思います:アマゾン・プライム・ビデオはHD 1080Pで視聴できます:有機ELなので、黒がきれいです:ヘッドホンでのドルビーアトモスに対応しています。-------------------------------------------------------------------------↓楽天市場以外の有名ストアの利用でも楽天ポイントが貯まります。----------------------------------------------------------------------------------------------------------------------------------------------------------------------------------------------------------------【ダッシュボード「COVID-19 Transition Graphs」を試作】こちらは、ジョンズ・ホプキンス大学のデータを利用したダッシュボードです。中国本土以外の地域への感染が拡大しているため、国別、地域別の感染者数の推移を簡単に確認できるダッシュボードを試作しています。随時、ページを追加しています。グラフのデータは、右上部分の操作でダウンロードすることができます。アメリカの「地域別の変数」を前処理して、「州別」での推移をグラフ化できるようにしました。また、州コードのフィールドを作成してコロプレス地図も作成しています。楽天ブログでは「iframe」タグが使えないので、Bloggerのページから利用できるようにしています。無料で利用できる、グーグルの「データポータル」のダッシュボードです。データさえあれば、簡単に作成できます。「国」別、「地域」別に日ごとの感染者数の推移を見ることができます。↓ダッシュボードの試作です。下記リンクのページから利用できます。ジョンズ・ホプキンス大学の「JHU CSSE」の「Covid19 Daily Reports」のデータを利用しています。 EdgeブラウザやIEブラウザなど、Chromeブラウザ以外での利用の場合はうまく表示されないことがあるようです。↓上記のダッシュボードのデータの出所のサイトです。マップがメインのダッシュボードです-----------------------------------------------------------------------------------------↓日本のインフルエンザの「定点当たり報告数」をグラフ化できるダッシュボードを試作。都道府県別にグラフ化可能です。--------------------------------------------------------------------------★おすすめの記事 ◆How Windows Sonic looks like.:Windows Sonic for Headphonesの音声と2chステレオ音声の比較:7.1.2chテストトーンの比較で明らかになった違い:一目で違いがわかりました----------------------------------------------------------------------------------------------------------
2020.11.02
コメント(0)
-
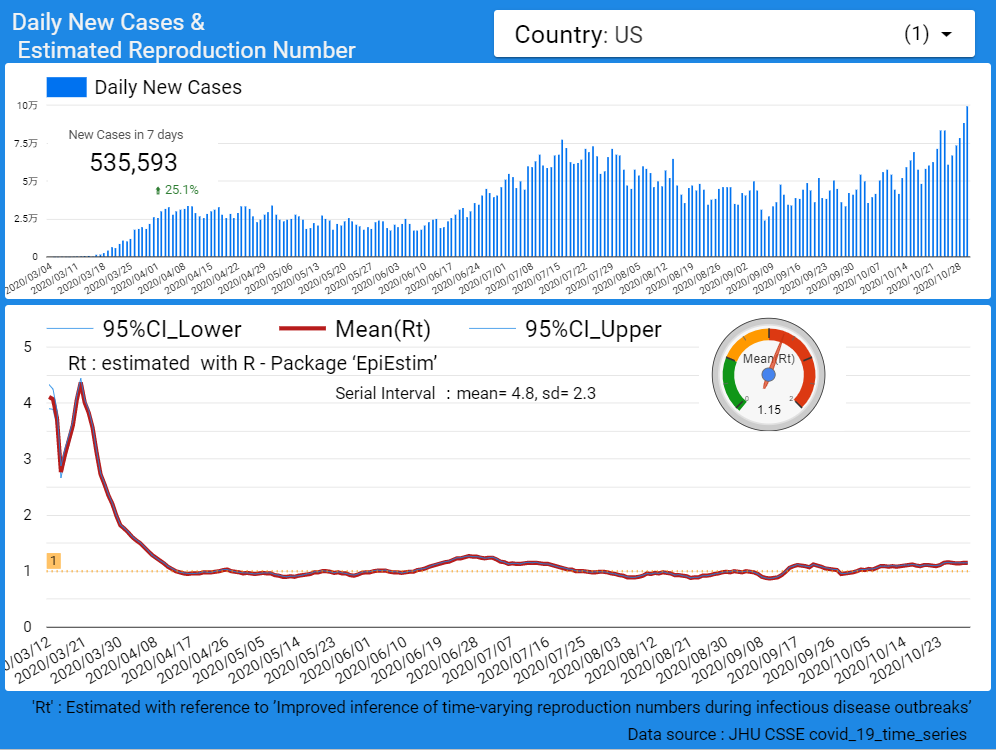
◆【新型コロナ】米国で感染確認者数が増加傾向に
大統領選挙を目前に控える米国で、感染確認者数が増加傾向にあります。↓米国の感染確認者数は、過去1週間でその前の1週間と比べて25.1%増加↓州別の直近の1日あたりの感染確認者数↓州別の直近の1日あたりの死亡者数テキサス州やフロリダ州での日々の死亡者数は多いようですが、感染確認者数の動向、死亡者数の動向は大統領選挙の投票行動に影響するのでしょうか。-------------------------------------------------------------------------------------------------------------------------------------------------------------楽天市場で「マスク」を検索する楽天市場で「ポビドンヨード」を検索する楽天市場で「イソジン うがい薬」を探す楽天市場で「うがい薬」を検索する楽天市場で「マウスウォッシュ・洗口液」を探す-----------------------------------------------------------------------楽天市場で「フコイダン」を探す-----------------------------------------------------------------------AQUOS sense3 lite+Rakuten UN-LIMITプランセット(事務手数料3300円込)【22000円相当のポイント還元】価格:31280円(税別、送料別)(2020/7/15時点)楽天で購入ついに、AQUOS sense3 liteも高額ポイントの対象になりました。マイナンバーカードの読み取りに対応している機種です。----------------------------------------------------------------------------------Galaxy A7+Rakuten UN-LIMITプランセット(事務手数料3300円込)【15000円相当のポイント還元】価格:22000円(税込、送料無料) (2020/5/31時点)楽天で購入↑楽天市場店で購入すればよかったと思います:アマゾン・プライム・ビデオはHD 1080Pで視聴できます:有機ELなので、黒がきれいです:ヘッドホンでのドルビーアトモスに対応しています。-------------------------------------------------------------------------↓楽天市場以外の有名ストアの利用でも楽天ポイントが貯まります。----------------------------------------------------------------------------------------------------------------------------------------------------------------------------------------------------------------【ダッシュボード「COVID-19 Transition Graphs」を試作】こちらは、ジョンズ・ホプキンス大学のデータを利用したダッシュボードです。中国本土以外の地域への感染が拡大しているため、国別、地域別の感染者数の推移を簡単に確認できるダッシュボードを試作しています。随時、ページを追加しています。グラフのデータは、右上部分の操作でダウンロードすることができます。アメリカの「地域別の変数」を前処理して、「州別」での推移をグラフ化できるようにしました。また、州コードのフィールドを作成してコロプレス地図も作成しています。楽天ブログでは「iframe」タグが使えないので、Bloggerのページから利用できるようにしています。無料で利用できる、グーグルの「データポータル」のダッシュボードです。データさえあれば、簡単に作成できます。「国」別、「地域」別に日ごとの感染者数の推移を見ることができます。↓ダッシュボードの試作です。下記リンクのページから利用できます。ジョンズ・ホプキンス大学の「JHU CSSE」の「Covid19 Daily Reports」のデータを利用しています。 EdgeブラウザやIEブラウザなど、Chromeブラウザ以外での利用の場合はうまく表示されないことがあるようです。↓上記のダッシュボードのデータの出所のサイトです。マップがメインのダッシュボードです-----------------------------------------------------------------------------------------↓日本のインフルエンザの「定点当たり報告数」をグラフ化できるダッシュボードを試作。都道府県別にグラフ化可能です。--------------------------------------------------------------------------★おすすめの記事 ◆How Windows Sonic looks like.:Windows Sonic for Headphonesの音声と2chステレオ音声の比較:7.1.2chテストトーンの比較で明らかになった違い:一目で違いがわかりました----------------------------------------------------------------------------------------------------------
2020.10.31
コメント(0)
-

◆【新型コロナ】欧州に第2波到来:死亡者数も増加傾向に
ヨーロッパでは感染確認者数の増加傾向が著しくなってきましたが、死亡者数も増加してきました。ヨーロッパでは、3月から4月にかけて死亡者数が増加しましたが、10月の死亡者数の増加傾向は、3月の動きに近づいてきているようにも見えます。ヨーロッパ人の約16%がネアンデルタール人由来の遺伝子を持っていて、その遺伝子が重症化と関係しているのではないか、という説が『nature』誌で発表されましたが、ヨーロッパで死亡者数が多くなっている理由はそれなのでしょうか。遺伝子によって、感染症の重症化リスクが異なるということからすると、ネアンデルタール人が消えたのも何かの感染症が原因だったのでしょうか。--------------------------------------------------------------------------------------------------------------------------------------------------------------楽天市場で「マスク」を検索する楽天市場で「ポビドンヨード」を検索する楽天市場で「イソジン うがい薬」を探す楽天市場で「うがい薬」を検索する楽天市場で「マウスウォッシュ・洗口液」を探す-----------------------------------------------------------------------楽天市場で「フコイダン」を探す-----------------------------------------------------------------------AQUOS sense3 lite+Rakuten UN-LIMITプランセット(事務手数料3300円込)【22000円相当のポイント還元】価格:31280円(税別、送料別)(2020/7/15時点)楽天で購入ついに、AQUOS sense3 liteも高額ポイントの対象になりました。マイナンバーカードの読み取りに対応している機種です。----------------------------------------------------------------------------------Galaxy A7+Rakuten UN-LIMITプランセット(事務手数料3300円込)【15000円相当のポイント還元】価格:22000円(税込、送料無料) (2020/5/31時点)楽天で購入↑楽天市場店で購入すればよかったと思います:アマゾン・プライム・ビデオはHD 1080Pで視聴できます:有機ELなので、黒がきれいです:ヘッドホンでのドルビーアトモスに対応しています。-------------------------------------------------------------------------↓楽天市場以外の有名ストアの利用でも楽天ポイントが貯まります。----------------------------------------------------------------------------------------------------------------------------------------------------------------------------------------------------------------【ダッシュボード「COVID-19 Transition Graphs」を試作】こちらは、ジョンズ・ホプキンス大学のデータを利用したダッシュボードです。中国本土以外の地域への感染が拡大しているため、国別、地域別の感染者数の推移を簡単に確認できるダッシュボードを試作しています。随時、ページを追加しています。グラフのデータは、右上部分の操作でダウンロードすることができます。アメリカの「地域別の変数」を前処理して、「州別」での推移をグラフ化できるようにしました。また、州コードのフィールドを作成してコロプレス地図も作成しています。楽天ブログでは「iframe」タグが使えないので、Bloggerのページから利用できるようにしています。無料で利用できる、グーグルの「データポータル」のダッシュボードです。データさえあれば、簡単に作成できます。「国」別、「地域」別に日ごとの感染者数の推移を見ることができます。↓ダッシュボードの試作です。下記リンクのページから利用できます。ジョンズ・ホプキンス大学の「JHU CSSE」の「Covid19 Daily Reports」のデータを利用しています。 EdgeブラウザやIEブラウザなど、Chromeブラウザ以外での利用の場合はうまく表示されないことがあるようです。↓上記のダッシュボードのデータの出所のサイトです。マップがメインのダッシュボードです-----------------------------------------------------------------------------------------↓日本のインフルエンザの「定点当たり報告数」をグラフ化できるダッシュボードを試作。都道府県別にグラフ化可能です。--------------------------------------------------------------------------★おすすめの記事 ◆How Windows Sonic looks like.:Windows Sonic for Headphonesの音声と2chステレオ音声の比較:7.1.2chテストトーンの比較で明らかになった違い:一目で違いがわかりました----------------------------------------------------------------------------------------------------------
2020.10.28
コメント(0)
-
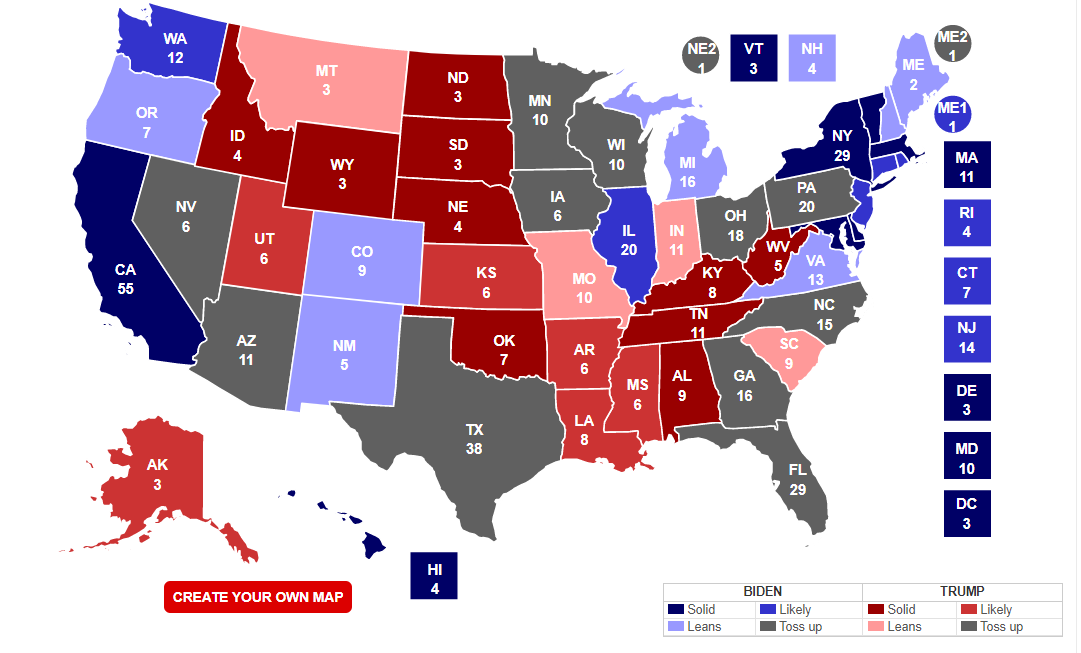
◆【米国大統領選挙】「Toss Up」の州の動向が注目されます:世界最古の民主主義制度による大統領選挙:米国では直近で感染確認者数が増加中。投票行動にどのような影響が出るのでしょうか
米国の大統領選挙が近づいてきました。接戦で、「toss up(硬貨投げ、五分五分)」の状況とされる州での結果が勝敗を左右すると考えられます。米国の歴史は浅いのですが、民主主義の国としては世界でも古い国ということになるようです。国のリーダーを民主主義的な選挙で選ぶ制度としては、米国の大統領選挙は世界で最も古い制度であるようです。建国からの年数が短い米国に「世界最古」があるというのは興味深いです。総得票数と勝者の得票数が異なる可能性がある「選挙人制度」「勝者総取り」とかは、古い時代の名残なのかもしれません。直接選挙ではなく、選挙人制度による選挙になっているのは、大統領選挙の制度が始まったのが18世紀だからです。当時は、当然テレビもラジオもインターネットもない時代で、新聞があったとしても普及率は低い上に、識字率も低く、国民が大統領候補についての情報を簡単に得ることはできませんでした。つまり、国民による直接選挙ができる環境が整っていなかったため、選挙人制度による選挙になったようです。世界最古の大統領選挙の制度、特に選挙人制度には問題点もあるようで、実際に、2016年の大統領選挙では、選挙人から得た得票数は、トランプ氏が304票、クリントン氏は227票ですが、国民からの得票数は、トランプ氏が62,984,828票(投票総数の46.09%)、クリントン氏が65,853,514票(48.18%)、その他候補が7,830,934票(5.73%)となっています。実際の国民のからの得票数と選挙人からの得票数との間の乖離は大きかったようです。ということは、選挙人の数が少ない州で圧勝することよりも、選挙人の数が多い州で僅差で勝利する方が重要である、ということになるようです。 今回の選挙では、新型コロナが選挙に大きな影響を与えるかもしれません。米国では、直近で、感染確認者数の増加が始まっているようです。新型コロナによる死亡者数の多い州で、どのような投票行動が見られるのか注目されます。↓新型コロナによる死亡者数累計のコロプレスマップ。激戦州とされるフロリダ州などで、死亡者数は多くなっているので、トランプ氏にとっては逆風のようです。↓米国の感染確認者数の増加が始まっているようです。--------------------------------------------------------------------------------------------------------------------------------------------------------------楽天市場で「マスク」を検索する楽天市場で「ポビドンヨード」を検索する楽天市場で「イソジン うがい薬」を探す楽天市場で「うがい薬」を検索する楽天市場で「マウスウォッシュ・洗口液」を探す-----------------------------------------------------------------------楽天市場で「フコイダン」を探す-----------------------------------------------------------------------AQUOS sense3 lite+Rakuten UN-LIMITプランセット(事務手数料3300円込)【22000円相当のポイント還元】価格:31280円(税別、送料別)(2020/7/15時点)楽天で購入ついに、AQUOS sense3 liteも高額ポイントの対象になりました。マイナンバーカードの読み取りに対応している機種です。----------------------------------------------------------------------------------Galaxy A7+Rakuten UN-LIMITプランセット(事務手数料3300円込)【15000円相当のポイント還元】価格:22000円(税込、送料無料) (2020/5/31時点)楽天で購入↑楽天市場店で購入すればよかったと思います:アマゾン・プライム・ビデオはHD 1080Pで視聴できます:有機ELなので、黒がきれいです:ヘッドホンでのドルビーアトモスに対応しています。-------------------------------------------------------------------------↓楽天市場以外の有名ストアの利用でも楽天ポイントが貯まります。----------------------------------------------------------------------------------------------------------------------------------------------------------------------------------------------------------------【ダッシュボード「COVID-19 Transition Graphs」を試作】こちらは、ジョンズ・ホプキンス大学のデータを利用したダッシュボードです。中国本土以外の地域への感染が拡大しているため、国別、地域別の感染者数の推移を簡単に確認できるダッシュボードを試作しています。随時、ページを追加しています。グラフのデータは、右上部分の操作でダウンロードすることができます。アメリカの「地域別の変数」を前処理して、「州別」での推移をグラフ化できるようにしました。また、州コードのフィールドを作成してコロプレス地図も作成しています。楽天ブログでは「iframe」タグが使えないので、Bloggerのページから利用できるようにしています。無料で利用できる、グーグルの「データポータル」のダッシュボードです。データさえあれば、簡単に作成できます。「国」別、「地域」別に日ごとの感染者数の推移を見ることができます。↓ダッシュボードの試作です。下記リンクのページから利用できます。ジョンズ・ホプキンス大学の「JHU CSSE」の「Covid19 Daily Reports」のデータを利用しています。 EdgeブラウザやIEブラウザなど、Chromeブラウザ以外での利用の場合はうまく表示されないことがあるようです。↓上記のダッシュボードのデータの出所のサイトです。マップがメインのダッシュボードです-----------------------------------------------------------------------------------------↓日本のインフルエンザの「定点当たり報告数」をグラフ化できるダッシュボードを試作。都道府県別にグラフ化可能です。--------------------------------------------------------------------------★おすすめの記事 ◆How Windows Sonic looks like.:Windows Sonic for Headphonesの音声と2chステレオ音声の比較:7.1.2chテストトーンの比較で明らかになった違い:一目で違いがわかりました----------------------------------------------------------------------------------------------------------
2020.10.26
コメント(0)
-
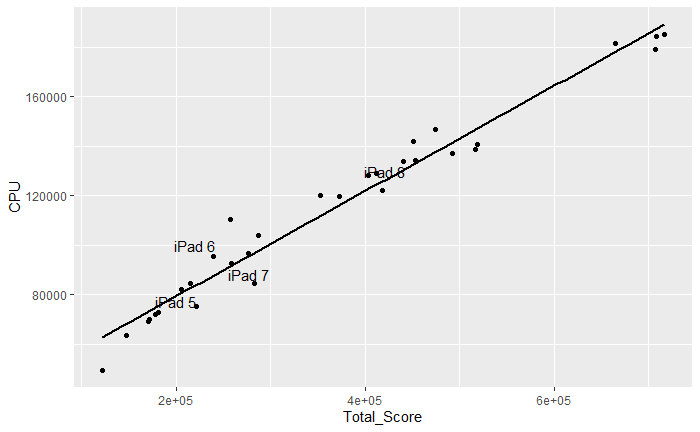
◆【新しいiPad】第8世代のiPadの性能が大幅に向上しました:非常にコスパが高いと思います:<Antutu Benchmark スコアから>
Antutu Benchmarkの9月のiOS機器のスコアを見ると、新しいiPadのスコアが出ていました。9月に発売された第8世代の新型のiPadは、A12 Bionicチップを搭載することによって、A10 Fusionチップを搭載した第7世代から大幅に性能が向上しています。グラフを見るとわかるように、iPadの第6世代から第7世代への性能向上は、スコアの上ではほんのわずかだったようです。第8世代の新しいiPadは、第3世代のiPad Airと同じチップを搭載しています。新iPadの32GBのWi-Fiモデルの価格が34,800円(税別)なので、コスパは非常に高いと言えそうです。↓iPadの世代間比較がしやすいように、他の機種の名称を表示していません。CPUやGPUのスコアはiPad Proの第4世代、第3世代が突出して高くなっていますが、UXスコアでは、第8世代のiPadは健闘しています。体感性能では、iPad Proと大きな差がない場面も多いのかもしれません。--------------------------------------------------------------------------------------------------------------------------------------------------------------楽天市場で「マスク」を検索する楽天市場で「ポビドンヨード」を検索する楽天市場で「イソジン うがい薬」を探す楽天市場で「うがい薬」を検索する楽天市場で「マウスウォッシュ・洗口液」を探す-----------------------------------------------------------------------楽天市場で「フコイダン」を探す-----------------------------------------------------------------------AQUOS sense3 lite+Rakuten UN-LIMITプランセット(事務手数料3300円込)【22000円相当のポイント還元】価格:31280円(税別、送料別)(2020/7/15時点)楽天で購入ついに、AQUOS sense3 liteも高額ポイントの対象になりました。マイナンバーカードの読み取りに対応している機種です。----------------------------------------------------------------------------------Galaxy A7+Rakuten UN-LIMITプランセット(事務手数料3300円込)【15000円相当のポイント還元】価格:22000円(税込、送料無料) (2020/5/31時点)楽天で購入↑楽天市場店で購入すればよかったと思います:アマゾン・プライム・ビデオはHD 1080Pで視聴できます:有機ELなので、黒がきれいです:ヘッドホンでのドルビーアトモスに対応しています。-------------------------------------------------------------------------↓楽天市場以外の有名ストアの利用でも楽天ポイントが貯まります。----------------------------------------------------------------------------------------------------------------------------------------------------------------------------------------------------------------【ダッシュボード「COVID-19 Transition Graphs」を試作】こちらは、ジョンズ・ホプキンス大学のデータを利用したダッシュボードです。中国本土以外の地域への感染が拡大しているため、国別、地域別の感染者数の推移を簡単に確認できるダッシュボードを試作しています。随時、ページを追加しています。グラフのデータは、右上部分の操作でダウンロードすることができます。アメリカの「地域別の変数」を前処理して、「州別」での推移をグラフ化できるようにしました。また、州コードのフィールドを作成してコロプレス地図も作成しています。楽天ブログでは「iframe」タグが使えないので、Bloggerのページから利用できるようにしています。無料で利用できる、グーグルの「データポータル」のダッシュボードです。データさえあれば、簡単に作成できます。「国」別、「地域」別に日ごとの感染者数の推移を見ることができます。↓ダッシュボードの試作です。下記リンクのページから利用できます。ジョンズ・ホプキンス大学の「JHU CSSE」の「Covid19 Daily Reports」のデータを利用しています。 EdgeブラウザやIEブラウザなど、Chromeブラウザ以外での利用の場合はうまく表示されないことがあるようです。↓上記のダッシュボードのデータの出所のサイトです。マップがメインのダッシュボードです-----------------------------------------------------------------------------------------↓日本のインフルエンザの「定点当たり報告数」をグラフ化できるダッシュボードを試作。都道府県別にグラフ化可能です。--------------------------------------------------------------------------★おすすめの記事 ◆How Windows Sonic looks like.:Windows Sonic for Headphonesの音声と2chステレオ音声の比較:7.1.2chテストトーンの比較で明らかになった違い:一目で違いがわかりました----------------------------------------------------------------------------------------------------------
2020.10.25
コメント(0)
-
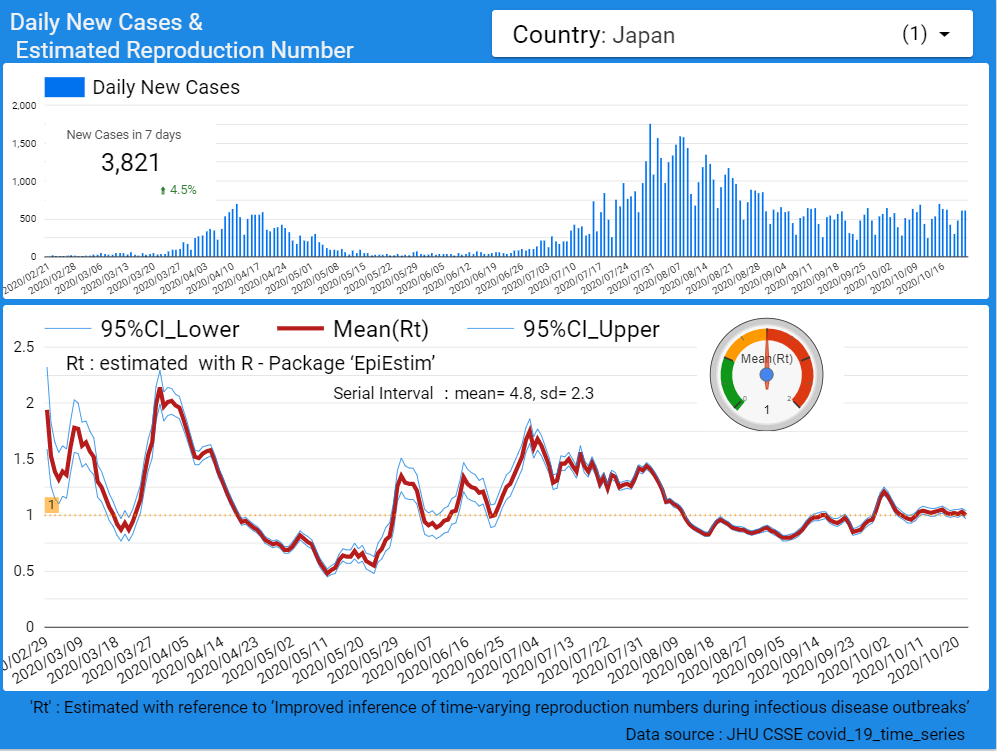
【新型コロナ】日本の感染確認者数は横ばいで推移中:実効再生産数は1前後で推移しています
日本では、新型コロナウイルスの感染確認者数は、今のところ横ばいで推移しています。実効再生産数の値は、1を挟んで上下していて、まさに、横ばいであることがわかります。↓右上のプルダウンリストで、世界の国々のグラフに切り替えることができます。日本の感染確認者数は、7月から8月にかけて増加し、8月から9月にかけて減少し、9月から10月は横ばい状態になっています。夏に増加したというのは、意外な感じでした。これから冬に向かう中で、感染確認者数が減少していくとは考えづらいのですが、どのように推移していくのでしょうか。日本の死亡者数は、増加傾向にはないようですが、減少している様子もなく、感染確認者数と同様に横ばいのようです。--------------------------------------------------------------------------------------------------------------------------------------------------------------楽天市場で「マスク」を検索する楽天市場で「ポビドンヨード」を検索する楽天市場で「イソジン うがい薬」を探す楽天市場で「うがい薬」を検索する楽天市場で「マウスウォッシュ・洗口液」を探す-----------------------------------------------------------------------楽天市場で「フコイダン」を探す-----------------------------------------------------------------------AQUOS sense3 lite+Rakuten UN-LIMITプランセット(事務手数料3300円込)【22000円相当のポイント還元】価格:31280円(税別、送料別)(2020/7/15時点)楽天で購入ついに、AQUOS sense3 liteも高額ポイントの対象になりました。マイナンバーカードの読み取りに対応している機種です。----------------------------------------------------------------------------------Galaxy A7+Rakuten UN-LIMITプランセット(事務手数料3300円込)【15000円相当のポイント還元】価格:22000円(税込、送料無料) (2020/5/31時点)楽天で購入↑楽天市場店で購入すればよかったと思います:アマゾン・プライム・ビデオはHD 1080Pで視聴できます:有機ELなので、黒がきれいです:ヘッドホンでのドルビーアトモスに対応しています。-------------------------------------------------------------------------↓楽天市場以外の有名ストアの利用でも楽天ポイントが貯まります。----------------------------------------------------------------------------------------------------------------------------------------------------------------------------------------------------------------【ダッシュボード「COVID-19 Transition Graphs」を試作】こちらは、ジョンズ・ホプキンス大学のデータを利用したダッシュボードです。中国本土以外の地域への感染が拡大しているため、国別、地域別の感染者数の推移を簡単に確認できるダッシュボードを試作しています。随時、ページを追加しています。グラフのデータは、右上部分の操作でダウンロードすることができます。アメリカの「地域別の変数」を前処理して、「州別」での推移をグラフ化できるようにしました。また、州コードのフィールドを作成してコロプレス地図も作成しています。楽天ブログでは「iframe」タグが使えないので、Bloggerのページから利用できるようにしています。無料で利用できる、グーグルの「データポータル」のダッシュボードです。データさえあれば、簡単に作成できます。「国」別、「地域」別に日ごとの感染者数の推移を見ることができます。↓ダッシュボードの試作です。下記リンクのページから利用できます。ジョンズ・ホプキンス大学の「JHU CSSE」の「Covid19 Daily Reports」のデータを利用しています。 EdgeブラウザやIEブラウザなど、Chromeブラウザ以外での利用の場合はうまく表示されないことがあるようです。↓上記のダッシュボードのデータの出所のサイトです。マップがメインのダッシュボードです-----------------------------------------------------------------------------------------↓日本のインフルエンザの「定点当たり報告数」をグラフ化できるダッシュボードを試作。都道府県別にグラフ化可能です。--------------------------------------------------------------------------★おすすめの記事 ◆How Windows Sonic looks like.:Windows Sonic for Headphonesの音声と2chステレオ音声の比較:7.1.2chテストトーンの比較で明らかになった違い:一目で違いがわかりました----------------------------------------------------------------------------------------------------------
2020.10.23
コメント(0)
-
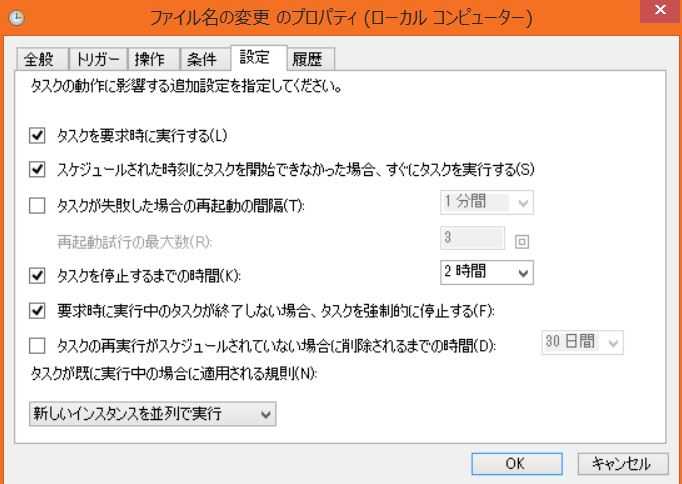
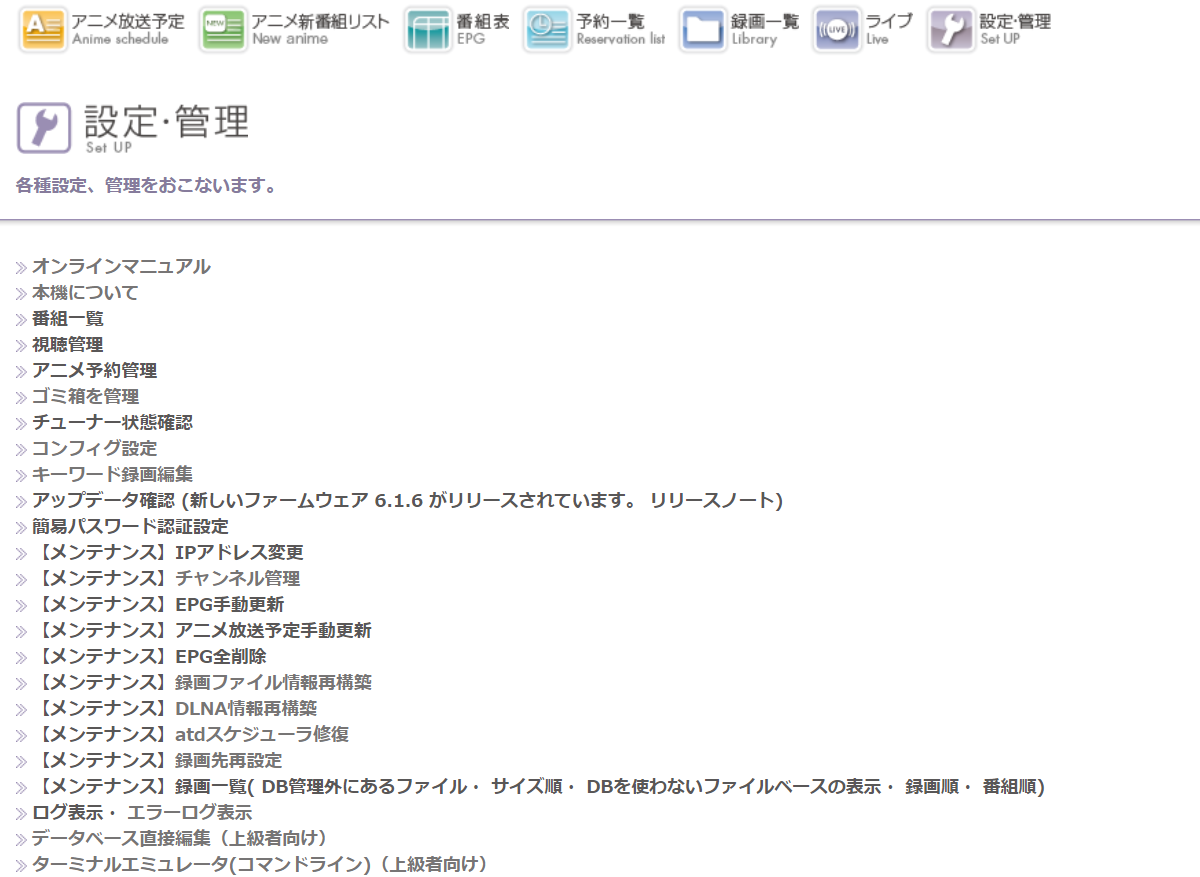
◆【テレビ録画・ラジオ録音サーバー】やっと成功!Plex用のフォルダにrobocopyで録画ファイルをコピーして、録画ファイル名を変更する処理:バッチファイルの定期的実行による自動処理ができました
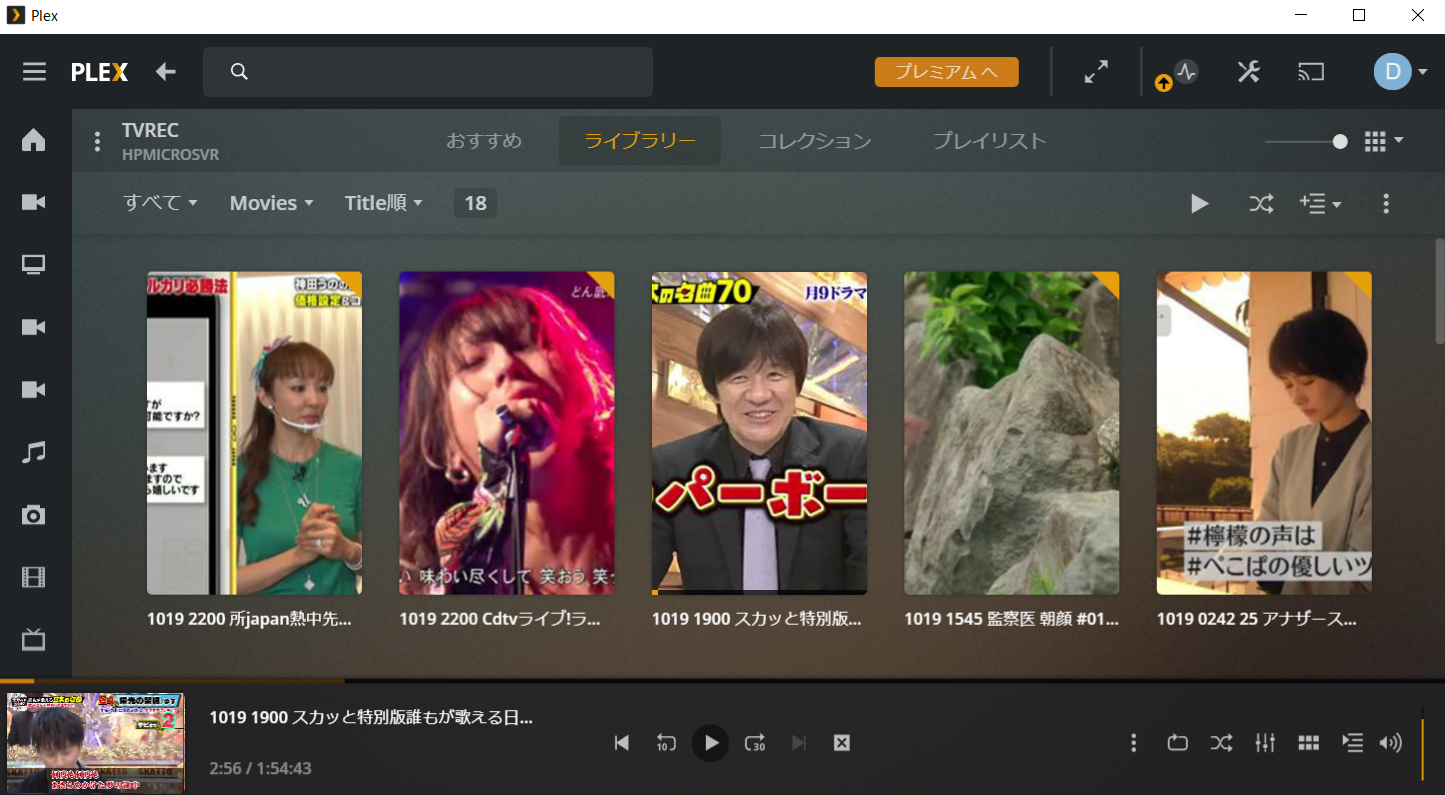
foltia Animel Lockerで録画したテレビ番組や、録音したラジオ番組のファイルを、Windowsパソコンで運用しているPlexメディアサーバーに読み込んで視聴するようにしましたが、録画(録音)ファイルのコピーと録画(録音)ファイル名の変更を自動実行で処理するようにしました。 当初、タスクスケジューラでの予約実行がうまくできていませんでしたが、タスクスケジューラの設定がようやく整い、録画ファイルのコピーと録画ファイル名の変更のデイリー処理が何とかできるようになりました。まさに試行錯誤を重ねました。1日目にタスクが成功していたのに、2日目に失敗したのは、「新しいインスタンス」の開始問題によるものだったようですが、開始したインスタンスを停止させないと、新しいインスタンスが開始できない仕組みのようです。どうやら、テスト実行の際に、バッチファイルの実行の様子を確認するために、「pause」コマンドを最後に入れていたのがよくなかったようです。「pause」コマンドは削除しました。念のため、「新しいインスタンスが開始できない」ということを防ぐため、開始したインスタンスを停止しておく必要があります。タスク開始後、2時間後に停止する設定にしました。そのうえで、さらに念のため、並列して新しいインスタンスを実行するという設定にしておけば、停止が失敗していても、新しいインスタンスを開始できるのではないかと思います。ところで、「インスタンス」って何のことでしょうか。調べてみてもよくわかりませんが、メモリ上にあるプログラムのようなことでしょうか。◆タスクスケジューラで実行するタスク(バッチファイル)さて、録画ファイルのコピーは、robocopyコマンドを利用したバッチファイルでの処理です。下記のスクリプトの内容をバッチファイルとして保存します。アニメロッカーで過去24時間以内に新規に録画したファイルを、Plexのパソコンのフォルダにコピーします。次に、Plexのライブラリで見やすいように、録画ファイルの名前を変更します。「キーワード録画」とか「EPG録画」などの文字列とその後の数字を削除します。録画ファイル名の変更は、正規表現を使用する必要があったため、PowerShellのバッチファイルによる処理です。なお、PowerShellのバッチファイルは、直接起動できないので、起動用のバッチファイルを作成する必要があります。バッチファイルは、メモ帳で作成し、保存の際、文字コードを「ANSI」として、拡張子を「.bat」として保存します。録画ファイルのコピーのバッチファイルは、コマンドプロンプトをスタートメニューから起動したときのカレントディレクトリ(通常はCドライブのログインユーザーのフォルダだと思います。プロンプトの前に表示されているディレクトリです)に置きました。これだとパスを通す必要がないと思います。録画ファイル名の変更のバッチファイルと起動用バッチファイルは、コピーした録画ファイルのあるフォルダに置きました。タスクスケジューラで上記のバッチファイルを起動する場合は、「最上位の特権で処理」を選び、1日に1回、早朝に1時間ほど間隔をあけてバッチファイルを実行するようにスケジュールを設定しました。結局、録画ファイルコピーと録画ファイル名の変更の自動実行のための作業としては、それぞれの処理のコマンドのバッチファイル作成という作業と、バッチファイルのタスクスケジューラによる定期的実行の設定という作業の2段階の作業があったということになりますが、二つ目のタスクスケジューラの設定を軽く見ていたのが失敗の原因でした。【robocopyのスクリプト例】robocopy \\FOLTIA\JP-file-style\01-全録画 E:\PLEX /MAXAGE:1 /S /XF *.ts /XD AAC MP4-HD MP4-SD MPEG2 /R:0 /LOG+:C:\robocopy.log【録画ファイル名変更のスクリプト例】Set-Location -path E:\PLEX$before1 = "_EPG録画_[0-9]+_"$after1= "_"$before2 = "_キーワード録画_[0-9]+_"$after2= "_"$dir = $Args[0]$itemList = Get-ChildItem . -Recurseforeach($item in $itemList){ if(-not $item.PSIsContainer) { Get-ChildItem $item.FullName | Rename-Item -NewName { $_.Name -replace $before1,$after1} Get-ChildItem $item.FullName | Rename-Item -NewName { $_.Name -replace $before2,$after2} }}-------------------------------------------------【上記の録画ファイル名変更のスクリプトを起動するバッチファイル】pushd %~dp0powershell -ExecutionPolicy Bypass -command "%~dp0録画ファイルから文字列削除.ps1" -------------------------------------------------↓Plexメディアサーバーのライブラリーの画面は、サムネイル表示が格好良く、スマホなどの小さな画面でも直観的にわかりやすくなっています。--------------------------------------------------------------------------------------------------------------------------------------------------------------楽天市場で「マスク」を検索する楽天市場で「ポビドンヨード」を検索する楽天市場で「イソジン うがい薬」を探す楽天市場で「うがい薬」を検索する楽天市場で「マウスウォッシュ・洗口液」を探す-----------------------------------------------------------------------楽天市場で「フコイダン」を探す-----------------------------------------------------------------------AQUOS sense3 lite+Rakuten UN-LIMITプランセット(事務手数料3300円込)【22000円相当のポイント還元】価格:31280円(税別、送料別)(2020/7/15時点)楽天で購入ついに、AQUOS sense3 liteも高額ポイントの対象になりました。マイナンバーカードの読み取りに対応している機種です。----------------------------------------------------------------------------------Galaxy A7+Rakuten UN-LIMITプランセット(事務手数料3300円込)【15000円相当のポイント還元】価格:22000円(税込、送料無料) (2020/5/31時点)楽天で購入↑楽天市場店で購入すればよかったと思います:アマゾン・プライム・ビデオはHD 1080Pで視聴できます:有機ELなので、黒がきれいです:ヘッドホンでのドルビーアトモスに対応しています。-------------------------------------------------------------------------↓楽天市場以外の有名ストアの利用でも楽天ポイントが貯まります。----------------------------------------------------------------------------------------------------------------------------------------------------------------------------------------------------------------【ダッシュボード「COVID-19 Transition Graphs」を試作】こちらは、ジョンズ・ホプキンス大学のデータを利用したダッシュボードです。中国本土以外の地域への感染が拡大しているため、国別、地域別の感染者数の推移を簡単に確認できるダッシュボードを試作しています。随時、ページを追加しています。グラフのデータは、右上部分の操作でダウンロードすることができます。アメリカの「地域別の変数」を前処理して、「州別」での推移をグラフ化できるようにしました。また、州コードのフィールドを作成してコロプレス地図も作成しています。楽天ブログでは「iframe」タグが使えないので、Bloggerのページから利用できるようにしています。無料で利用できる、グーグルの「データポータル」のダッシュボードです。データさえあれば、簡単に作成できます。「国」別、「地域」別に日ごとの感染者数の推移を見ることができます。↓ダッシュボードの試作です。下記リンクのページから利用できます。ジョンズ・ホプキンス大学の「JHU CSSE」の「Covid19 Daily Reports」のデータを利用しています。 EdgeブラウザやIEブラウザなど、Chromeブラウザ以外での利用の場合はうまく表示されないことがあるようです。↓上記のダッシュボードのデータの出所のサイトです。マップがメインのダッシュボードです-----------------------------------------------------------------------------------------↓日本のインフルエンザの「定点当たり報告数」をグラフ化できるダッシュボードを試作。都道府県別にグラフ化可能です。--------------------------------------------------------------------------★おすすめの記事 ◆How Windows Sonic looks like.:Windows Sonic for Headphonesの音声と2chステレオ音声の比較:7.1.2chテストトーンの比較で明らかになった違い:一目で違いがわかりました----------------------------------------------------------------------------------------------------------
2020.10.23
コメント(0)
-
◆【テレビ録画・ラジオ録音サーバー】Plexへの録画ファイルのコピーとファイル名変更をバッチファイルで実行するようにしました
パソコンを高機能、多機能なテレビ録画サーバー兼ラジオ録音サーバーに変身させるソフトが、foltia Anime Lockerです。foltia Anime Lockerをインストールしたパソコンは、nasneと同じような機能を備えたものになります。ラジオ録音ができるという部分では、nasneの機能を超えていると言えるでしょう。そして、録画ファイルを動画配信サービスのサイトのような見た目で管理できるのがPlexメディアサーバーです。フォルティア・アニメ・ロッカーで録画したファイルをWindowsパソコンにコピーして、Plexメディアサーバーを利用して視聴することを試していますが、録画ファイルの自動コピーが課題でした。ファイルの自動コピーについては、Windowsの標準の機能である「robocopy」を利用したバッチファイルを1日に1回、タスクスケジューラで実行するようにしました。下記のようなrobocopyのスクリプトによって、アニメロッカーのLAN上のDLNAのフォルダから録画ファイルをコピーしてきます。たった2行ほどのスクリプトで、自動コピーができるというのは便利だと思います。なお、スクリプトのオプション設定の詳細については、先日のブログに記載しています。【robocopyのスクリプト例】robocopy \\FOLTIA\JP-file-style\01-全録画 E:\PLEX /MAXAGE:1 /S /XF *.ts /XD AAC MP4-HD MP4-SD MPEG2 /R:0 /LOG+:C:\robocopy.log【追記:今朝確認すると、昨日成功していたタスクススケジューラによるコピー処理が行われていませんでした。同じ設定、同じ条件で1度成功しているのに、不思議なことです。とりあえず、手動で実行した後で、再び実行されないように、「/L」オプションを付けて、バッチファイルを普通に実行すると、確かに「アクセスが拒否されました」とエラーになっていました。管理者としてバッチファイルを実行すると、問題なく処理されます。対策として、robocopyのバッチファイルを起動するバッチファイルを作成して、その起動用バッチファイルをタスクスケジューラの「最上位の特権で実行する」で実行するようにしたらうまくいきました。元の設定でも直接「最上位の特権で実行する」としていたのに不思議です。明日、うまく処理されているのか確認したいと思います。「/L」は外しておきます。】【翌朝、再び確認すると、コピー処理も名前変更も実行できていませんでした。タスクを手動で実行すると、処理が行われます。履歴を確認すると「新しいインスタンスを開始できませんでした」みたいなエラーだったので、「既存のインスタンスを停止」の設定に変更したり、「タスクを停止するまでの時間」を3日間から1日間に変更したりしました。1度成功したのに2回目に失敗したのは、「新しいインスタンス」の問題のせいだとすると、make sense です。スケジュールを変更してテストした結果では成功したので、明日こそ成功していることを望みます。】【翌々朝、確認すると、録画ファイルコピーのタスク、録画ファイル名変更のタスクの両方が成功していました。タスクが実行されなかったのは、「新しいインスタンスの開始」の設定に問題があったからのようです。】下記は、上記のスクリプトの実行結果のログです。スクリプトの実行前の1日間に新規に録画されたファイルだけがコピーされています。コピーをスキップしているのは、tsファイルです。なお、中略の部分には、コピー先である「E:\PLEX」のフォルダにあるファイル(コピー済みのファイル)が表示されていました。それにしても、録画ファイルのコピーの速度は速いようです。パソコン間のLANは、有線の1000BASE-Tの環境ですが、1GBのファイルのコピーに5秒もかかっていないようです。エクスプローラーを使ってコピーした場合は、1秒間に40~50MBくらいの速度だったりするので、その4~5倍速い計算になります。------------------------------------------------------------------------------- ROBOCOPY :: Windows の堅牢性の高いファイル コピー ------------------------------------------------------------------------------- 開始: 2020年10月20日 3:45:01 コピー元 : \\FOLTIA\JP-file-style\01-全録画\ コピー先 : E:\PLEX\ ファイル: *.* 除外ファイル: *.ts 除外ディレクトリ: AAC MP4-HD MP4-SD MPEG2 オプション: *.* /S /DCOPY:DA /COPY:DAT /MAXAGE:1 /R:1 /W:30 ------------------------------------------------------------------------------中略------------------------------------------------------------------------------ 合計 コピー済み スキップ 不一致 失敗 Extras ディレクトリ: 7 0 3 0 0 3 ファイル: 35 4 31 0 0 30 バイト: 23.906 g 1.070 g 22.836 g 0 0 12.426 g 時刻: 0:00:15 0:00:14 0:00:00 0:00:00 速度: 77030200 バイト/秒 速度: 4407.703 MB/分 終了: 2020年10月20日 3:45:17◇通常のコマンドのバッチファイルでは、うまくできなかったファイル名の変更録画ファイルの自動コピーができるようになったので、次はファイル名の変更です。変更といっても、デフォルトの「録画日時、録画予約方法、番組名、番組説明」といった、長いファイル名のうち、「録画予約方法」の部分を削除するだけです。Plexの画面で録画ファイルの一覧を表示させるときに、サムネイルありのグリッド形式では、「キーワード録画_数字」「EPG録画_数字」といった録画予約方法の部分までの表示になる場合があり、その後ろにある番組名が見づらいという問題がありました。当初、コマンドのバッチファイルで「キーワード録画_数字」「EPG録画_数字」の部分を削除しようとしました。しかし、「キーワード録画」「EPG録画」といった固定の文字列の削除はできましたが、録画番組ごとに変わる数字の部分を削除することはできませんでした。一昨日までの録画ファイルはこの数字が残っています。普通のコマンドのバッチファイルでは、「[0-9]+」(数字の繰り返し)のような正規表現が利用できませんでした。そこで、昨日に録画したファイルから、PowerShellのスクリプトを利用して処理することにしました。下記の記事などを参考にさせていただき、録画ファイルの名前に含まれている「キーワード録画_数字」「EPG録画_数字」の部分を削除しました。実際には、当該文字列を「_」(アンダーバー)に置き換えています。この処理をすることによって、Plexのサムネイル画面上で番組名がわかりやすくなりました。ほんの少しのことですが、番組名がわかりにくいというストレスが軽減されます。↓こちらのサイトのPowerShellのコードを基にバッチファイルを作成しました。【録画ファイル名変更のスクリプト例】Set-Location -path E:\PLEX$before1 = "_EPG録画_[0-9]+_"$after1= "_"$before2 = "_キーワード録画_[0-9]+_"$after2= "_"$dir = $Args[0]$itemList = Get-ChildItem . -Recurseforeach($item in $itemList){ if(-not $item.PSIsContainer) { Get-ChildItem $item.FullName | Rename-Item -NewName { $_.Name -replace $before1,$after1} Get-ChildItem $item.FullName | Rename-Item -NewName { $_.Name -replace $before2,$after2} }}-------------------------------------------------【上記の録画ファイル名変更のスクリプトを起動するバッチファイル】pushd %~dp0powershell -ExecutionPolicy Bypass -command "%~dp0録画ファイルから文字列削除.ps1" ----------------------------------------------------PowerShellの「録画ファイルから文字列削除.ps1」のファイルと、そのファイルの起動用のバッチファイルは、録画ファイルのコピー先である「E:\PLEX」のフォルダに置いています。タスクスケジューラで起動用のバッチファイルを1日1回走らせるように設定しようと思います。アニメロッカー側での処理を行わずに、Windowsの無料のツールで録画ファイルのコピーとファイル名変更の処理ができました。この処理をしているのが、Windows 8.1のパソコンなので、PowerShell Coreをインストールする必要がありましたが、スクリプトファイル自体はメモ帳で作成できます。リナックスになじみのない私が、リナックスで同じことをするよりも簡単にできたと思いますが、バッチファイルの実行では、「カレントディレクトリ」などの設定がわかりにくく、何度もやり直しましたが、なんとか処理できるようになりました。まあ、PowerShellがリナックスより簡単なわけではありませんが、使い慣れたWindowsの環境で利用できるというのがメリットです。Windowsでも、いろいろなことが、かなり簡単にできることがわかりました。以上、アニメロッカーで録画したファイルの管理という、ニッチな実用情報ですが、備忘録もかねてまとめてみました。なお、robocopy の概要やオプション設定については、下記のページがわかりやすいと思います。---------------------------------------------------------------------------------------------------------------------------------------------------------------楽天市場で「マスク」を検索する楽天市場で「ポビドンヨード」を検索する楽天市場で「イソジン うがい薬」を探す楽天市場で「うがい薬」を検索する楽天市場で「マウスウォッシュ・洗口液」を探す-----------------------------------------------------------------------楽天市場で「フコイダン」を探す-----------------------------------------------------------------------AQUOS sense3 lite+Rakuten UN-LIMITプランセット(事務手数料3300円込)【22000円相当のポイント還元】価格:31280円(税別、送料別)(2020/7/15時点)楽天で購入ついに、AQUOS sense3 liteも高額ポイントの対象になりました。マイナンバーカードの読み取りに対応している機種です。----------------------------------------------------------------------------------Galaxy A7+Rakuten UN-LIMITプランセット(事務手数料3300円込)【15000円相当のポイント還元】価格:22000円(税込、送料無料) (2020/5/31時点)楽天で購入↑楽天市場店で購入すればよかったと思います:アマゾン・プライム・ビデオはHD 1080Pで視聴できます:有機ELなので、黒がきれいです:ヘッドホンでのドルビーアトモスに対応しています。-------------------------------------------------------------------------↓楽天市場以外の有名ストアの利用でも楽天ポイントが貯まります。----------------------------------------------------------------------------------------------------------------------------------------------------------------------------------------------------------------【ダッシュボード「COVID-19 Transition Graphs」を試作】こちらは、ジョンズ・ホプキンス大学のデータを利用したダッシュボードです。中国本土以外の地域への感染が拡大しているため、国別、地域別の感染者数の推移を簡単に確認できるダッシュボードを試作しています。随時、ページを追加しています。グラフのデータは、右上部分の操作でダウンロードすることができます。アメリカの「地域別の変数」を前処理して、「州別」での推移をグラフ化できるようにしました。また、州コードのフィールドを作成してコロプレス地図も作成しています。楽天ブログでは「iframe」タグが使えないので、Bloggerのページから利用できるようにしています。無料で利用できる、グーグルの「データポータル」のダッシュボードです。データさえあれば、簡単に作成できます。「国」別、「地域」別に日ごとの感染者数の推移を見ることができます。↓ダッシュボードの試作です。下記リンクのページから利用できます。ジョンズ・ホプキンス大学の「JHU CSSE」の「Covid19 Daily Reports」のデータを利用しています。 EdgeブラウザやIEブラウザなど、Chromeブラウザ以外での利用の場合はうまく表示されないことがあるようです。↓上記のダッシュボードのデータの出所のサイトです。マップがメインのダッシュボードです-----------------------------------------------------------------------------------------↓日本のインフルエンザの「定点当たり報告数」をグラフ化できるダッシュボードを試作。都道府県別にグラフ化可能です。--------------------------------------------------------------------------★おすすめの記事 ◆How Windows Sonic looks like.:Windows Sonic for Headphonesの音声と2chステレオ音声の比較:7.1.2chテストトーンの比較で明らかになった違い:一目で違いがわかりました----------------------------------------------------------------------------------------------------------
2020.10.20
コメント(0)
-
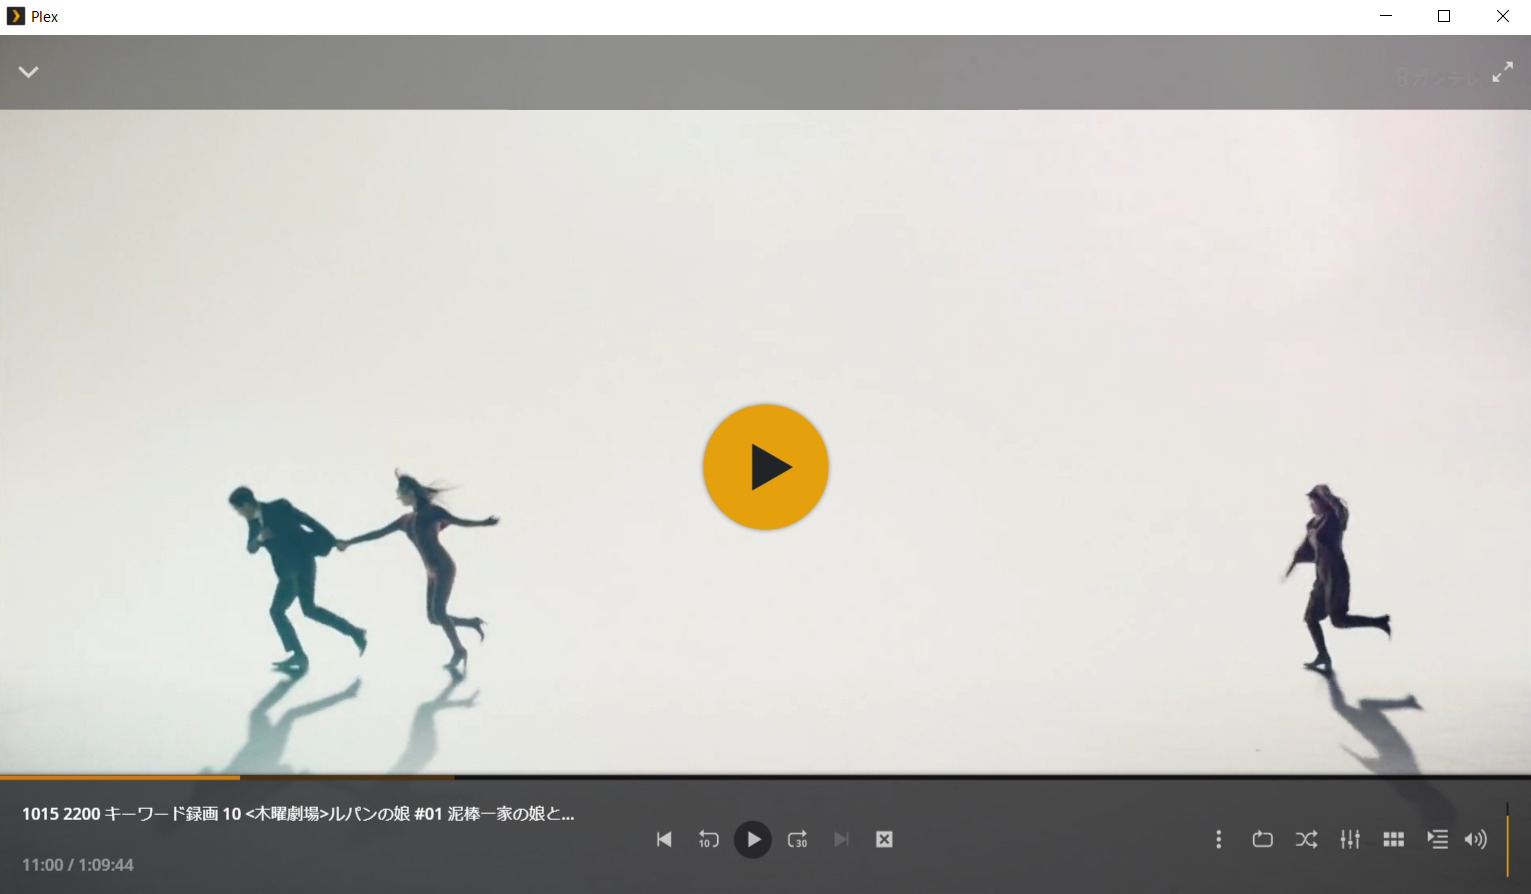
◆【テレビ録画・ラジオ録音サーバー】録画はアニメロッカーで、視聴はPlexで行うことにしてみました:Plexのプレーヤーにはレジューム機能や「30秒早送り」「10秒巻き戻し」機能、チャプター機能があるので快適です:robocopyコマンドでファイルコピーの自動実行を試してみます
アニメロッカーをインストールすると、DIYで、パソコンをnasneを超える高機能なテレビ録画・ラジオ録音サーバーにすることができます。なお、ラジオの録音は、インターネット経由での録音なので電波環境に音質が左右されることはありません。アニメロッカーを使うと、DIYでチューナーの数や録画容量を自由にカスタマイズすることができます。でも、パソコンのスペックにもよるでしょうが、録画はTSファイルなので、3~4チューナー以上で同時録画をするとドロップが起きやすいのではないかと思います。実用的なのは、3~4番組同時録画くらいでしょうか。録画後もMP4への変換作業があるので、同時録画と変換作業が重なるとかなりHDDへの負荷が高くなると思われます。nasneと同じような機能を持つfoltia Anime Lockerは、その名の通り、特にアニメ番組の録画に便利ですが、アニメ以外のテレビ番組の録画についても、「EPG予約録画」のほかに、「キーワード録画予約」の機能があるので、不便を感じることはありません。ただし、「EPG予約録画」で録画した場合の録画ファイルの「番組名」が「EPG録画」となります。EPGでの録画予約の確認画面では、「番組名」欄に番組名の情報が存在しているのにおかしな仕様です。「キーワード録画予約」で録画した場合の「番組名」も「キーワード録画」となります。「サブタイトル」欄に番組名と番組内容の説明が一緒に入っているので、何の番組かわからないことはないのですが、この仕様は見直してほしいと思います。さすがに、アニメロッカーという名称なので、アニメの自動録画の場合は「番組名」がちゃんと表示されます。番組説明文も検索対象にできる「キーワード録画予約」の機能を使えば、番組名だけでなく出演者名やテーマなどでも録画予約が可能です。「キーワード録画予約」の範囲にはラジオ番組も含まれています。アニメロッカーの視聴機能にも、番組内シーンのキャプチャー画像一覧から、見たい場面にアクセスできるという便利な機能があります。アニメの場合だと、場面の展開を俯瞰することができます。でも、この機能は、ドラマや映画の視聴には使わないでしょう。情報番組やバラエティ、音楽番組で使えるかもしれませんが、恐らく、かなりのアニメ好きでないとあまり使わない機能なのではないかと思います。いずれにしても、アニメロッカーが、複数の番組を同時録画していたり、あるいは、MP4ファイルをソフトウエアエンコードで作成したりしている途中で、録画ファイルを視聴したりするのは機器に負荷をかけてしまうと考えられます。アニメロッカーは、たくさんのチューナーを搭載して多チャンネル録画が可能ですが、エンコードはソフトウェアエンコードなので、大量に録画すると、機器への負荷は相当高くなると考えられます。そこで、アニメロッカーには録画に特化してもらって、録画したファイルの視聴はPlexで行うようにすると、アニメロッカーの負荷軽減につながり、視聴もより快適になるのではないかと思います。Plexの大きな魅力の一つは、ライブラリー画面でサムネイル画像でファイルが表示されるところだと思います。画像の有り無しで、見やすさは大きく異なります。画像があると、見やすく、わかりやすく、楽しい感じになります。検索窓から、Plexに登録した録画番組を検索することもスムーズにできます。番組名の文字列の一部を入力するだけで、検索して視聴できます。ファイル数が増えてきても安心です。動画配信サービスの画面に、録画したファイルが追加されていく、といったイメージになるのではないかと思います。Plexを利用すると、視聴する録画ファイルを選ぶのが楽しく感じられます。また、パソコンでのPlexのプレーヤーにはレジューム機能や「30秒早送り」「10秒巻き戻し」機能があるのでTverのように、再生の時に便利です。さらに、チャプターを利用した再生機能があり、CMと本編の区切りを利用して視聴することができます。アニメロッカーで、MP4ファイル作成時にCMチャプターを作成している場合、録画ファイルをPlexに取り込んだ後、CMチャプターを利用した視聴がすぐに可能になります。ただし、VLCメディアプレーヤーの「>|」のようなスキップボタン方式ではなく、チャプターごとのサムネイルが表示されてサムネイルを選ぶ形での再生になります。スキップボタン式の方が操作がシンプルなので、Plexのプレーヤーにもスキップボタンがあるといいのにと思います。アニメロッカーでは、自動CMカットができますが、たくさんの番組を録画する場合は、マシンのリソースを使うのであまり利用しない方がいいのかな、と思っています。Plex メディアサーバーをインストールしたWindows 8.1のパソコンがあるので、そのパソコンの記憶域の中のフォルダにアニメロッカーの録画ファイルをコピーしました。↓アニメロッカーの録画ファイルは、DLNAによって、Windowsのネットワークから参照でき、ファイルをコピーすることができます。Plexメディアサーバーのライブラリに、録画ファイルをコピーしたフォルダを追加すると、そのフォルダ内の録画ファイルをPlexメディアサーバーで配信することができます。Plexのライブラリー画面には、録画ファイルのサムネイル画像が表示されますが、録画がCM部分から始まっていると、CM画像になるので、サムネイル画像のフレームの位置を録画開始5分後とかに指定できるといいのにと思います。ライブラリで表示されている画像の左下の「鉛筆マーク」をクリックすると、ファイル名やサムネイル画像(「ポスター」と呼ぶようです)を変更できますが、変更の候補は録画ファイルの冒頭部分の3つのフレームなので、本編の画像が含まれていない場合があります。その場合、本編の画像をキャプチャーしたものなどに変更することが可能ですが、手間がかかりすぎます。いずれにしても、アニメロッカーの録画サーバー機から、Plexメディアサーバーが参照しているWindowsパソコンのフォルダに録画ファイルをコピーするだけで、録画ファイルをPlexで扱うことができるようになります。アニメロッカーの録画ファイルは手動で削除するようにしようと思いますが、録画ファイルのコピーは、Windowsパソコンに「robocopy」のコマンドのバッチファイルを実行させて自動化することを考えています。ただ、TSファイルをコピーしたくないのですが、現在想定している、フォルダごと自動でコピーする方法でMP4ファイルのフォルダだけを選ぼうとすると、オプションの設定をしないと、月が変わるごとにディレクトリの記述などを変更する必要があるかもしれません。「robocopy」のフォルダ除外のオプションなどについて調べてみました。なお、「robocopy」でDLNAのフォルダからコピーする方法では、コピー元のファイルのアーカイブビットのオン・オフなどはできないので、通常の差分バックアップや増分バックアップはできそうにありません。自動化するには、別の工夫が必要です。やはり、アニメロッカーの側からWindowsパソコンに録画ファイルをコピーする方法を検討する必要があるのかもしれません。その場合は、リナックスについて勉強する必要があります。とりあえず、Windowsでどこまでできるのか、「robocopy」のオプションを調べて、下記のように工夫してみました。テスト運用して、2~3日、様子を見てみます。今回、初めて利用しますが、「robocopy」のオプションは豊富で、バックアップの細かな設定が簡単にできるようです。下記の内容のバッチファイルをメモ帳で作成して、文字コードを「ANSI」とし、拡張子を「.bat」にして保存します。robocopy \\FOLTIA\JP-file-style\01-全録画 E:\PLEX /MAXAGE:1 /S /XF *.ts /XD AAC MP4-HD MP4-SD MPEG2 /R:0「/MAXAGE:1」として、直近24時間以内の新しいファイルをコピー対象にします。試しに、タスクスケジューラーで1日に1回、このバッチファイルを実行する形で運用してみます。その他、「/XF *.ts 」で、tsファイルをコピー対象外とします。「/S」でサブフォルダを対象に加えつつ、「/XD AAC MP4-HD MP4-SD MPEG2」で、重複するフォルダ、不要なフォルダをコピー対象外にします。早朝にコピー作業をするので、暴走を防ぐために、「/R:0」としてリトライをしないようにしておきます。「JP-file-style」のフォルダ内のファイル名は長すぎて、Plexの画面でファイル名を見づらいという問題点もありますが、それは今後の課題です。なお、Plexメディアサーバーから、アニメロッカーのフォルダを参照するようにすれば、アニメロッカーの録画ファイルを直接Plexで配信することは可能ですが、この場合は、録画ファイルの再生時にアニメロッカーのHDDなどに負荷がかかることになりますし、録画ファイルのバックアップにもならないので避けたい方法です。また、Plexメディアサーバーの「テレビ番組」のライブラリにアニメロッカーの録画ファイルをそのまま参照させてもサムネイルの表示は機能しません。どうやら、海外ドラマ仕様になっているようで、「シーズン」と「エピソード」という要素が必要のようです。録画ファイルにタグ情報を追加すれば、きれいに整理されて表示されるはずですが、録画ファイルの名前などをPlex向けに変更すれば少しは改善されるのかもしれません。確実にライブラリに整然と表示させるためには、iTunesに録画ファイルを登録するのと同様に、タグ情報を入力する必要があるようです。手間ひまをかければ、「テレビ番組のライブラリー」にドラマとかを整然と表示させることができるようですが、ファイル名をそのままにして普通に利用するには、「動画」のライブラリで参照する必要があるようです。アニメロッカーが、録画ファイルのプロパティへの自動タグ付けに対応したら、Plexだけでなく、iTunesに登録する場合にもとても役立つと思います。---------------------------------------------------------------------------------------------------------------------------------------------------------------楽天市場で「マスク」を検索する楽天市場で「ポビドンヨード」を検索する楽天市場で「イソジン うがい薬」を探す楽天市場で「うがい薬」を検索する楽天市場で「マウスウォッシュ・洗口液」を探す-----------------------------------------------------------------------楽天市場で「フコイダン」を探す-----------------------------------------------------------------------AQUOS sense3 lite+Rakuten UN-LIMITプランセット(事務手数料3300円込)【22000円相当のポイント還元】価格:31280円(税別、送料別)(2020/7/15時点)楽天で購入ついに、AQUOS sense3 liteも高額ポイントの対象になりました。マイナンバーカードの読み取りに対応している機種です。----------------------------------------------------------------------------------Galaxy A7+Rakuten UN-LIMITプランセット(事務手数料3300円込)【15000円相当のポイント還元】価格:22000円(税込、送料無料) (2020/5/31時点)楽天で購入↑楽天市場店で購入すればよかったと思います:アマゾン・プライム・ビデオはHD 1080Pで視聴できます:有機ELなので、黒がきれいです:ヘッドホンでのドルビーアトモスに対応しています。-------------------------------------------------------------------------↓楽天市場以外の有名ストアの利用でも楽天ポイントが貯まります。----------------------------------------------------------------------------------------------------------------------------------------------------------------------------------------------------------------【ダッシュボード「COVID-19 Transition Graphs」を試作】こちらは、ジョンズ・ホプキンス大学のデータを利用したダッシュボードです。中国本土以外の地域への感染が拡大しているため、国別、地域別の感染者数の推移を簡単に確認できるダッシュボードを試作しています。随時、ページを追加しています。グラフのデータは、右上部分の操作でダウンロードすることができます。アメリカの「地域別の変数」を前処理して、「州別」での推移をグラフ化できるようにしました。また、州コードのフィールドを作成してコロプレス地図も作成しています。楽天ブログでは「iframe」タグが使えないので、Bloggerのページから利用できるようにしています。無料で利用できる、グーグルの「データポータル」のダッシュボードです。データさえあれば、簡単に作成できます。「国」別、「地域」別に日ごとの感染者数の推移を見ることができます。↓ダッシュボードの試作です。下記リンクのページから利用できます。ジョンズ・ホプキンス大学の「JHU CSSE」の「Covid19 Daily Reports」のデータを利用しています。 EdgeブラウザやIEブラウザなど、Chromeブラウザ以外での利用の場合はうまく表示されないことがあるようです。↓上記のダッシュボードのデータの出所のサイトです。マップがメインのダッシュボードです-----------------------------------------------------------------------------------------↓日本のインフルエンザの「定点当たり報告数」をグラフ化できるダッシュボードを試作。都道府県別にグラフ化可能です。--------------------------------------------------------------------------★おすすめの記事 ◆How Windows Sonic looks like.:Windows Sonic for Headphonesの音声と2chステレオ音声の比較:7.1.2chテストトーンの比較で明らかになった違い:一目で違いがわかりました----------------------------------------------------------------------------------------------------------
2020.10.18
コメント(0)
-
◆【新型コロナ】ヨーロッパ各国の実効再生産数は?:ヨーロッパに第2波到来
ECDCのデータを利用したダッシュボードで、ヨーロッパの主要な国々の感染確認者数の増加傾向や実効再生産数を見てみました。各国の感染確認者数は明らかに増加傾向にあります。死亡者数も増加していますが、今のところ、第1波と比べると、かなり少なく抑えられています。実効再生産数は、イタリアが1.57、ドイツが1.42、オランダが1.3などとなっていて、急速に増加している国があることがわかります。↓イギリス。左上のプルダウンメニューで世界中の200以上の国(地域)を選択できるようにしています。↓フランス↓ドイツ↓オランダ↓イタリア↓スペイン---------------------------------------------------------------------------------------------------------------------------------------------------------------楽天市場で「マスク」を検索する楽天市場で「ポビドンヨード」を検索する楽天市場で「イソジン うがい薬」を探す楽天市場で「うがい薬」を検索する楽天市場で「マウスウォッシュ・洗口液」を探す-----------------------------------------------------------------------楽天市場で「フコイダン」を探す-----------------------------------------------------------------------AQUOS sense3 lite+Rakuten UN-LIMITプランセット(事務手数料3300円込)【22000円相当のポイント還元】価格:31280円(税別、送料別)(2020/7/15時点)楽天で購入ついに、AQUOS sense3 liteも高額ポイントの対象になりました。マイナンバーカードの読み取りに対応している機種です。----------------------------------------------------------------------------------Galaxy A7+Rakuten UN-LIMITプランセット(事務手数料3300円込)【15000円相当のポイント還元】価格:22000円(税込、送料無料) (2020/5/31時点)楽天で購入↑楽天市場店で購入すればよかったと思います:アマゾン・プライム・ビデオはHD 1080Pで視聴できます:有機ELなので、黒がきれいです:ヘッドホンでのドルビーアトモスに対応しています。-------------------------------------------------------------------------↓楽天市場以外の有名ストアの利用でも楽天ポイントが貯まります。----------------------------------------------------------------------------------------------------------------------------------------------------------------------------------------------------------------【ダッシュボード「COVID-19 Transition Graphs」を試作】こちらは、ジョンズ・ホプキンス大学のデータを利用したダッシュボードです。中国本土以外の地域への感染が拡大しているため、国別、地域別の感染者数の推移を簡単に確認できるダッシュボードを試作しています。随時、ページを追加しています。グラフのデータは、右上部分の操作でダウンロードすることができます。アメリカの「地域別の変数」を前処理して、「州別」での推移をグラフ化できるようにしました。また、州コードのフィールドを作成してコロプレス地図も作成しています。楽天ブログでは「iframe」タグが使えないので、Bloggerのページから利用できるようにしています。無料で利用できる、グーグルの「データポータル」のダッシュボードです。データさえあれば、簡単に作成できます。「国」別、「地域」別に日ごとの感染者数の推移を見ることができます。↓ダッシュボードの試作です。下記リンクのページから利用できます。ジョンズ・ホプキンス大学の「JHU CSSE」の「Covid19 Daily Reports」のデータを利用しています。 EdgeブラウザやIEブラウザなど、Chromeブラウザ以外での利用の場合はうまく表示されないことがあるようです。↓上記のダッシュボードのデータの出所のサイトです。マップがメインのダッシュボードです-----------------------------------------------------------------------------------------↓日本のインフルエンザの「定点当たり報告数」をグラフ化できるダッシュボードを試作。都道府県別にグラフ化可能です。--------------------------------------------------------------------------★おすすめの記事 ◆How Windows Sonic looks like.:Windows Sonic for Headphonesの音声と2chステレオ音声の比較:7.1.2chテストトーンの比較で明らかになった違い:一目で違いがわかりました----------------------------------------------------------------------------------------------------------
2020.10.17
コメント(0)
-
◆【新型コロナ】ヨーロッパに第2波?:感染確認者数は急増し、死亡者数も増加傾向にあります
ヨーロッパでは、感染確認者数が9月から増え始め、10月はさらに増加のペースが速くなっています。感染確認者数だけでなく、死亡者数も9月中旬頃から増加傾向にあることがわかります。↓ECDCのデータを利用したダッシュボードです。横軸は「日」、折れ線グラフは月別です。Google アナリティクスなどのレポートでもよく使われているグラフのスタイルですが、月ごとの推移の傾向がわかりやすいと思います。アジア、アフリカ、アメリカ、オセアニアでは、感染確認者数や死亡者数は、今のところほぼ横ばいで推移しているようです。ECDCのデータには、「大陸別」など、地域分類の変数が含まれているので、簡単に世界の地域別のデータを見ることができます。---------------------------------------------------------------------------------------------------------------------------------------------------------------楽天市場で「マスク」を検索する楽天市場で「ポビドンヨード」を検索する楽天市場で「イソジン うがい薬」を探す楽天市場で「うがい薬」を検索する楽天市場で「マウスウォッシュ・洗口液」を探す-----------------------------------------------------------------------楽天市場で「フコイダン」を探す-----------------------------------------------------------------------AQUOS sense3 lite+Rakuten UN-LIMITプランセット(事務手数料3300円込)【22000円相当のポイント還元】価格:31280円(税別、送料別)(2020/7/15時点)楽天で購入ついに、AQUOS sense3 liteも高額ポイントの対象になりました。マイナンバーカードの読み取りに対応している機種です。----------------------------------------------------------------------------------Galaxy A7+Rakuten UN-LIMITプランセット(事務手数料3300円込)【15000円相当のポイント還元】価格:22000円(税込、送料無料) (2020/5/31時点)楽天で購入↑楽天市場店で購入すればよかったと思います:アマゾン・プライム・ビデオはHD 1080Pで視聴できます:有機ELなので、黒がきれいです:ヘッドホンでのドルビーアトモスに対応しています。-------------------------------------------------------------------------↓楽天市場以外の有名ストアの利用でも楽天ポイントが貯まります。----------------------------------------------------------------------------------------------------------------------------------------------------------------------------------------------------------------【ダッシュボード「COVID-19 Transition Graphs」を試作】こちらは、ジョンズ・ホプキンス大学のデータを利用したダッシュボードです。中国本土以外の地域への感染が拡大しているため、国別、地域別の感染者数の推移を簡単に確認できるダッシュボードを試作しています。随時、ページを追加しています。グラフのデータは、右上部分の操作でダウンロードすることができます。アメリカの「地域別の変数」を前処理して、「州別」での推移をグラフ化できるようにしました。また、州コードのフィールドを作成してコロプレス地図も作成しています。楽天ブログでは「iframe」タグが使えないので、Bloggerのページから利用できるようにしています。無料で利用できる、グーグルの「データポータル」のダッシュボードです。データさえあれば、簡単に作成できます。「国」別、「地域」別に日ごとの感染者数の推移を見ることができます。↓ダッシュボードの試作です。下記リンクのページから利用できます。ジョンズ・ホプキンス大学の「JHU CSSE」の「Covid19 Daily Reports」のデータを利用しています。 EdgeブラウザやIEブラウザなど、Chromeブラウザ以外での利用の場合はうまく表示されないことがあるようです。↓上記のダッシュボードのデータの出所のサイトです。マップがメインのダッシュボードです-----------------------------------------------------------------------------------------↓日本のインフルエンザの「定点当たり報告数」をグラフ化できるダッシュボードを試作。都道府県別にグラフ化可能です。--------------------------------------------------------------------------★おすすめの記事 ◆How Windows Sonic looks like.:Windows Sonic for Headphonesの音声と2chステレオ音声の比較:7.1.2chテストトーンの比較で明らかになった違い:一目で違いがわかりました----------------------------------------------------------------------------------------------------------
2020.10.16
コメント(0)
-
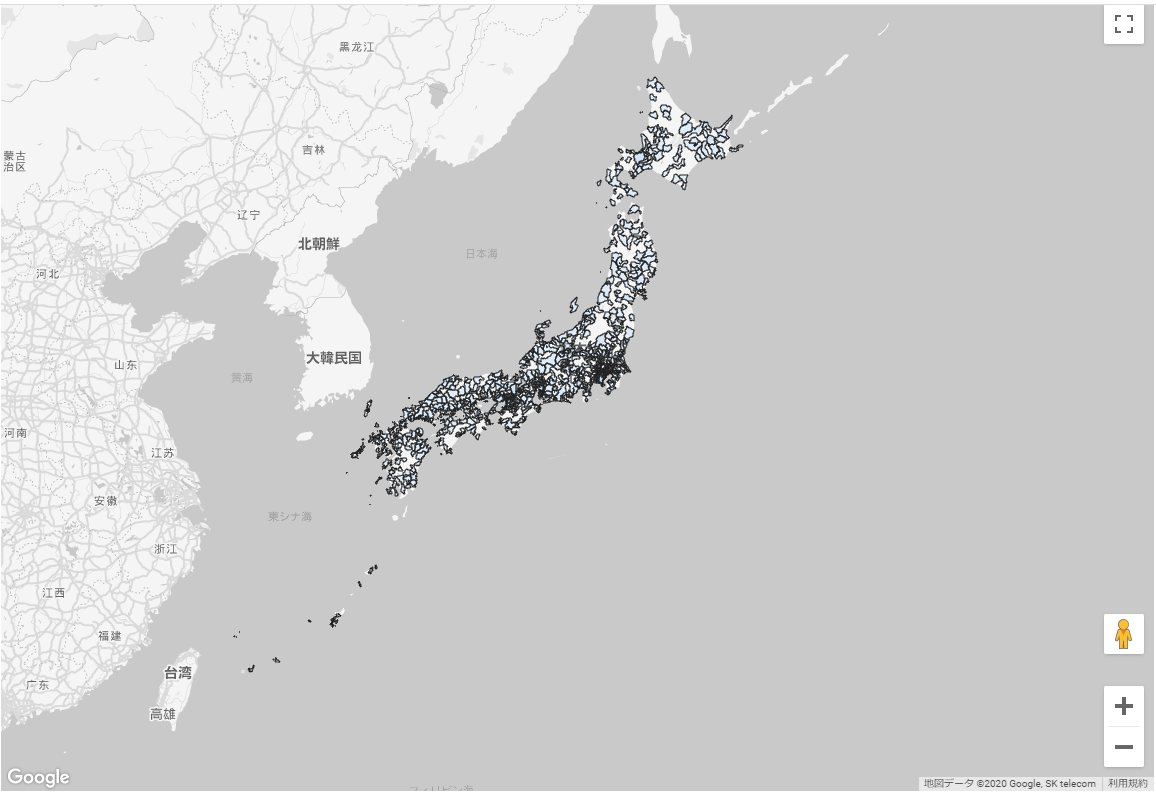
◆【Google アナリティクス】IPアドレスから推定されている市区町村は、全国で827:地図上にプロットしてみました
Google アナリティクスの地理的な分析に用いられている日本の市区町村の数は、827です。Googleは、アクセス解析で得られるIPアドレスから、どこからのアクセスなのかを市区町村別に落とし込んでいるわけですが、Google アナリティクスで利用されている日本の市区町村用のIDは827、都道府県IDが47、東京都特別区が1、Naze Oaza Koshuku(Kagoshima)が1で、計876IDとなっています。IPアドレスによる推定なので、ユーザーの住所というよりもアクセス場所ということになります。東京都の23区についてはIDはありますが、横浜市や大阪市などの「区」別のIDはなく、市単位です。Googleの地域IDの「Criteria ID」は独自のもので、日本の地方自治体コードとは全く異なっています。Googleが公開している地域コードリストの都道府県名と市区町村名の英文表記を利用して、Googleの独自の地域IDである「Criteria ID」と日本の地方自治体コードをマッチングさせてみました。結合には、ExcelのPower Queryのテーブル結合機能を利用しています。↓Googleの地域IDに日本の市区町村別人口を紐づけて、データポータルでグラフ化したものです。当然ですが、市区町村のIDが827個なので、空白の市区町村もかなりあることがわかります。日本の地方自治体コードが紐づけられれば、上の図のように政府統計などのデータとGoogle アナリティクスのデータを結び付けた分析ができるようになります。Google アナリティクスのデータの地域分析の幅が大きく広がります。例えば、Google アナリティクスのセッション数やユーザー数から、人口10万人あたりのセッション数などの指標を算出して分析することも可能になります。もちろん、IPアドレスによるアクセス地域の推定なので、厳密なものにはなり得ません。スマホからのアクセスであれば、外出先からのアクセスが多いかもしれません。あるいは、VPNを利用したアクセスも含まれている可能性があります。それにしても、地域コードのマッチングはかなり面倒なので、GoogleにはJISコードも使ってほしいと思います。---------------------------------------------------------------------------------------------------------------------------------------------------------------楽天市場で「マスク」を検索する楽天市場で「ポビドンヨード」を検索する楽天市場で「イソジン うがい薬」を探す楽天市場で「うがい薬」を検索する楽天市場で「マウスウォッシュ・洗口液」を探す-----------------------------------------------------------------------楽天市場で「フコイダン」を探す-----------------------------------------------------------------------AQUOS sense3 lite+Rakuten UN-LIMITプランセット(事務手数料3300円込)【22000円相当のポイント還元】価格:31280円(税別、送料別)(2020/7/15時点)楽天で購入ついに、AQUOS sense3 liteも高額ポイントの対象になりました。マイナンバーカードの読み取りに対応している機種です。----------------------------------------------------------------------------------Galaxy A7+Rakuten UN-LIMITプランセット(事務手数料3300円込)【15000円相当のポイント還元】価格:22000円(税込、送料無料) (2020/5/31時点)楽天で購入↑楽天市場店で購入すればよかったと思います:アマゾン・プライム・ビデオはHD 1080Pで視聴できます:有機ELなので、黒がきれいです:ヘッドホンでのドルビーアトモスに対応しています。-------------------------------------------------------------------------↓楽天市場以外の有名ストアの利用でも楽天ポイントが貯まります。----------------------------------------------------------------------------------------------------------------------------------------------------------------------------------------------------------------【ダッシュボード「COVID-19 Transition Graphs」を試作】こちらは、ジョンズ・ホプキンス大学のデータを利用したダッシュボードです。中国本土以外の地域への感染が拡大しているため、国別、地域別の感染者数の推移を簡単に確認できるダッシュボードを試作しています。随時、ページを追加しています。グラフのデータは、右上部分の操作でダウンロードすることができます。アメリカの「地域別の変数」を前処理して、「州別」での推移をグラフ化できるようにしました。また、州コードのフィールドを作成してコロプレス地図も作成しています。楽天ブログでは「iframe」タグが使えないので、Bloggerのページから利用できるようにしています。無料で利用できる、グーグルの「データポータル」のダッシュボードです。データさえあれば、簡単に作成できます。「国」別、「地域」別に日ごとの感染者数の推移を見ることができます。↓ダッシュボードの試作です。下記リンクのページから利用できます。ジョンズ・ホプキンス大学の「JHU CSSE」の「Covid19 Daily Reports」のデータを利用しています。 EdgeブラウザやIEブラウザなど、Chromeブラウザ以外での利用の場合はうまく表示されないことがあるようです。↓上記のダッシュボードのデータの出所のサイトです。マップがメインのダッシュボードです-----------------------------------------------------------------------------------------↓日本のインフルエンザの「定点当たり報告数」をグラフ化できるダッシュボードを試作。都道府県別にグラフ化可能です。--------------------------------------------------------------------------★おすすめの記事 ◆How Windows Sonic looks like.:Windows Sonic for Headphonesの音声と2chステレオ音声の比較:7.1.2chテストトーンの比較で明らかになった違い:一目で違いがわかりました----------------------------------------------------------------------------------------------------------
2020.10.13
コメント(0)
-
◆【foltia Anime Locker】録画用HDDの容量はほどほどにすることにしました:バックアップ用のHDDを大容量にしたほうがよさそうです
アニメロッカーの録画サーバーのデータベースが逝ってしまったのか、「録画済み番組」が表示されなくなってしまいました。起動ディスクは128GBのSSD、録画領域用のHDDとして3TBのWDのPurpleのHDD2台で運用していたのですが、システムディスクの不具合なのか、録画領域のHDDの不具合なのかよくわかりませんが、録画番組がすべて表示されなくなってしまいました。もしかしたら、救出できる録画番組があるかもしれないので、起動ディスクと録画用ディスクを取り換えて、アニメロッカーを新規にインストールすることにしました。ずっとバージョン4.xだったので、この機会にバージョン6.xにアップグレードしました。バージョンアップによって、Windows PCのブラウザによる「ライブ視聴」が、再びできるようになりました。バージョン4.xでは、Windows PCのブラウザによる「ライブ視聴」ができなくなっていたので、この違いは大きいです。一方、コンフィグ設定のメニューから、ACD(アマゾン・クラウド・ドライブ)へのファイルアップロードメニュ-がなくなりましたが、NASやPCなどへのファイルの自動アップロードのメニューを作ってほしいと思います。録画領域を大容量にした場合、故障してしまうとどうしようもないので、録画領域は3TBにして、保存するファイルは、ファイルサーバーに移すようにします。新しいシステムディスクとして、家にあった80GBのWDのEnterpriseのHDDを使いました。録画領域用としては、3TBのWDのRedが家にあったので、内容を別のHDDに移して、再利用しました。なお、アニメロッカーのシステム領域は、バージョン5から拡大されたということですが、基本的にサイズは小さいようで、64GBのドライブでも十分なようです。バージョン4の場合は、32GBで十分だったようです。というか、バージョン4の場合は、32GB以上は意味がなかったようです。バージョン4では、録画ファイル数が多くなると、システム領域が容量不足になりましたが、最新のバージョンでも、大容量HDDで録画ファイル数を増やすとシステムが不安定になりそうなので、録画領域の大容量化はほどほどにする必要があるようです。録画領域は、300TBまで対応しているということですが、そんな超大容量だと、とてもシステムのデータベースが耐えられるとは思えません。NASなどに録画ファイルを移動させる機能やHDDの交換が簡単にできるような機能を充実させてほしいと思います。アニメロッカーは、リナックスの知識がないと、HDDの増設が難しいので、以前は6TBの録画領域にしていましたが、今後は、保存用のHDDを大容量にしていきたいと思います。↓今回のディスク構成です。[root@foltia foltia]# lsblkNAME MAJ:MIN RM SIZE RO TYPE MOUNTPOINT sdb 8:16 0 2.7T 0 disk └─tank-tv (dm-0) 253:0 0 2.7T 0 lvm /home/foltia/php/tv sda 8:0 0 76.7G 0 disk ├─sda1 8:1 0 320M 0 part /boot ├─sda2 8:2 0 25.7G 0 part / ├─sda3 8:3 0 5.9G 0 part [SWAP] └─sda4 8:4 0 44.9G 0 part sr0 11:0 1 1024M 0 rom[root@foltia foltia]# pvscan PV /dev/sdb VG tank lvm2 [2.73 TiB / 0 free] Total: 1 [2.73 TiB] / in use: 1 [2.73 TiB] / in no VG: 0 [0 ] [root@foltia foltia]# vgscan Reading all physical volumes. This may take a while... Found volume group "tank" using metadata type lvm2 [root@foltia foltia]# lvscan ACTIVE '/dev/tank/tv' [2.73 TiB] inherit 地デジ6チューナー、BS6チューナー搭載の録画サーバーですが、最近は、Tverなどが便利なため、フルに録画するようなことはほとんどなくなりました。それにしても、アニメロッカーのインストールはスムーズにいった試しがなく、ハードディスクの初期化処理のところでつまずいたようで、今回も何度かやり直しました。まあ、この種の録画システムの中では最もカンタンなのでしょうが。HDDの管理の部分がもっと簡単になり、録画ファイルのNASなどへのムーブやHDDの増設、交換がGUIのメニューでできるようになればいいと思います。アマゾンのクラウドドライブが容量無制限だった時に、アニメロッカーがACDに録画ファイルを書き出す機能を作成した時は、「すごい」と思いましたが、ACDの「容量無制限」はすぐに中止になってしまいました。リナックスに詳しい人にとっては簡単なことかもしれませんが、Plexメディアサーバーなどに録画ファイルを書き出すメニューを作成してほしいと思います。なお、アニメロッカーのMP4・1080p HDの変換画質であれば、15.6インチのノートパソコンやiPadなどで観る分には、Tverの画質と変わりはありません。1時間のMP4・1080p HDの録画ファイルの容量は約1GBなので、ファイルの容量的には、Tverより高画質なのかもしれません。録画ファイルは自由に保存、視聴できるので、やはりアニメロッカーは便利です。アニメロッカーは、EPGでラジオの録音予約も手軽にできる点も非常に便利だと思います。低スペックのパソコンをアニメロッカーによって、ラジオ録音サーバーにするというのもいいと思います。アニメロッカーによる録画サーバーは、nasneをはるかに上回る機能、能力を持っていると思います。---------------------------------------------------------------------------------------------------------------------------------------------------------------楽天市場で「マスク」を検索する楽天市場で「ポビドンヨード」を検索する楽天市場で「イソジン うがい薬」を探す楽天市場で「うがい薬」を検索する楽天市場で「マウスウォッシュ・洗口液」を探す-----------------------------------------------------------------------楽天市場で「フコイダン」を探す-----------------------------------------------------------------------AQUOS sense3 lite+Rakuten UN-LIMITプランセット(事務手数料3300円込)【22000円相当のポイント還元】価格:31280円(税別、送料別)(2020/7/15時点)楽天で購入ついに、AQUOS sense3 liteも高額ポイントの対象になりました。マイナンバーカードの読み取りに対応している機種です。----------------------------------------------------------------------------------Galaxy A7+Rakuten UN-LIMITプランセット(事務手数料3300円込)【15000円相当のポイント還元】価格:22000円(税込、送料無料) (2020/5/31時点)楽天で購入↑楽天市場店で購入すればよかったと思います:アマゾン・プライム・ビデオはHD 1080Pで視聴できます:有機ELなので、黒がきれいです:ヘッドホンでのドルビーアトモスに対応しています。-------------------------------------------------------------------------↓楽天市場以外の有名ストアの利用でも楽天ポイントが貯まります。----------------------------------------------------------------------------------------------------------------------------------------------------------------------------------------------------------------【ダッシュボード「COVID-19 Transition Graphs」を試作】こちらは、ジョンズ・ホプキンス大学のデータを利用したダッシュボードです。中国本土以外の地域への感染が拡大しているため、国別、地域別の感染者数の推移を簡単に確認できるダッシュボードを試作しています。随時、ページを追加しています。グラフのデータは、右上部分の操作でダウンロードすることができます。アメリカの「地域別の変数」を前処理して、「州別」での推移をグラフ化できるようにしました。また、州コードのフィールドを作成してコロプレス地図も作成しています。楽天ブログでは「iframe」タグが使えないので、Bloggerのページから利用できるようにしています。無料で利用できる、グーグルの「データポータル」のダッシュボードです。データさえあれば、簡単に作成できます。「国」別、「地域」別に日ごとの感染者数の推移を見ることができます。↓ダッシュボードの試作です。下記リンクのページから利用できます。ジョンズ・ホプキンス大学の「JHU CSSE」の「Covid19 Daily Reports」のデータを利用しています。 EdgeブラウザやIEブラウザなど、Chromeブラウザ以外での利用の場合はうまく表示されないことがあるようです。↓上記のダッシュボードのデータの出所のサイトです。マップがメインのダッシュボードです-----------------------------------------------------------------------------------------↓日本のインフルエンザの「定点当たり報告数」をグラフ化できるダッシュボードを試作。都道府県別にグラフ化可能です。--------------------------------------------------------------------------★おすすめの記事 ◆How Windows Sonic looks like.:Windows Sonic for Headphonesの音声と2chステレオ音声の比較:7.1.2chテストトーンの比較で明らかになった違い:一目で違いがわかりました----------------------------------------------------------------------------------------------------------
2020.10.11
コメント(0)
-
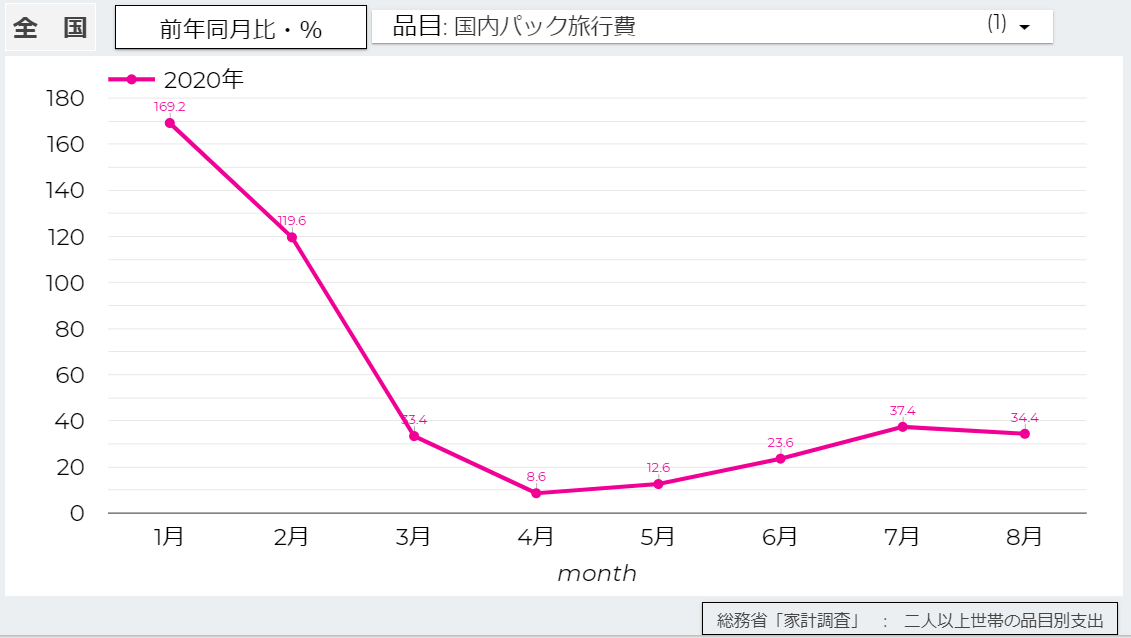
◆8月の国内パック旅行への支出は、まだ低水準のようです:総務省「家計調査」から
7月下旬から始まった「Go To トラベル」ですが、「家計調査」の8月の結果を見ると、まだ8月の時点では、「国内パック旅行費」への支出の水準は、前年同月比で34.4%と低水準のままでした。7月から8月にかけて、感染確認者数が増加したことが影響したのかもしれません。9月、10月で、どれくらい支出水準が改善しているのかが注目されます。↓総務省「家計調査」の8月のデータをデータポータルのダッシュボードに追加しました。外食や交通費などの品目を抜粋しています。全国データのほかに、都市別のデータのページもあります。品目×都市×調査月のデータを取り込もうとすると、すぐにグーグルスプレッドシートの容量をオーバーしてしまうので、品目数を絞っています。↓「GO TO トラベル」対象外だった東京はやはり低水準のようです。全国での緊急事態宣言は、引き締め過ぎだったようです。その後の「戻り」も弱い感じです。----------------------------------------------------------------------------------------------------------------------------------------------------------------楽天市場で「マスク」を検索する楽天市場で「ポビドンヨード」を検索する楽天市場で「イソジン うがい薬」を探す楽天市場で「うがい薬」を検索する楽天市場で「マウスウォッシュ・洗口液」を探す-----------------------------------------------------------------------楽天市場で「フコイダン」を探す-----------------------------------------------------------------------AQUOS sense3 lite+Rakuten UN-LIMITプランセット(事務手数料3300円込)【22000円相当のポイント還元】価格:31280円(税別、送料別)(2020/7/15時点)楽天で購入ついに、AQUOS sense3 liteも高額ポイントの対象になりました。マイナンバーカードの読み取りに対応している機種です。----------------------------------------------------------------------------------Galaxy A7+Rakuten UN-LIMITプランセット(事務手数料3300円込)【15000円相当のポイント還元】価格:22000円(税込、送料無料) (2020/5/31時点)楽天で購入↑楽天市場店で購入すればよかったと思います:アマゾン・プライム・ビデオはHD 1080Pで視聴できます:有機ELなので、黒がきれいです:ヘッドホンでのドルビーアトモスに対応しています。-------------------------------------------------------------------------↓楽天市場以外の有名ストアの利用でも楽天ポイントが貯まります。----------------------------------------------------------------------------------------------------------------------------------------------------------------------------------------------------------------【ダッシュボード「COVID-19 Transition Graphs」を試作】こちらは、ジョンズ・ホプキンス大学のデータを利用したダッシュボードです。中国本土以外の地域への感染が拡大しているため、国別、地域別の感染者数の推移を簡単に確認できるダッシュボードを試作しています。随時、ページを追加しています。グラフのデータは、右上部分の操作でダウンロードすることができます。アメリカの「地域別の変数」を前処理して、「州別」での推移をグラフ化できるようにしました。また、州コードのフィールドを作成してコロプレス地図も作成しています。楽天ブログでは「iframe」タグが使えないので、Bloggerのページから利用できるようにしています。無料で利用できる、グーグルの「データポータル」のダッシュボードです。データさえあれば、簡単に作成できます。「国」別、「地域」別に日ごとの感染者数の推移を見ることができます。↓ダッシュボードの試作です。下記リンクのページから利用できます。ジョンズ・ホプキンス大学の「JHU CSSE」の「Covid19 Daily Reports」のデータを利用しています。 EdgeブラウザやIEブラウザなど、Chromeブラウザ以外での利用の場合はうまく表示されないことがあるようです。↓上記のダッシュボードのデータの出所のサイトです。マップがメインのダッシュボードです-----------------------------------------------------------------------------------------↓日本のインフルエンザの「定点当たり報告数」をグラフ化できるダッシュボードを試作。都道府県別にグラフ化可能です。--------------------------------------------------------------------------★おすすめの記事 ◆How Windows Sonic looks like.:Windows Sonic for Headphonesの音声と2chステレオ音声の比較:7.1.2chテストトーンの比較で明らかになった違い:一目で違いがわかりました----------------------------------------------------------------------------------------------------------
2020.10.09
コメント(0)
-
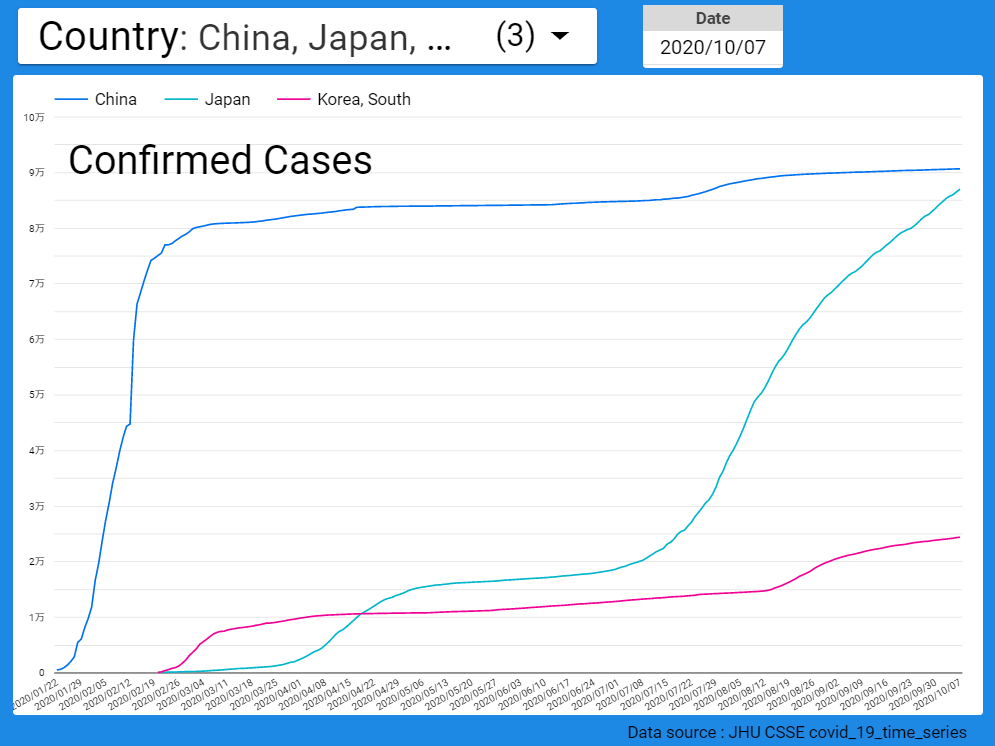
◆【新型コロナ】いつの間にか、日本の感染確認者数の累計が中国に迫っています
日本の日々の感染確認者数は、最近は横ばいで推移していますが、累計値で見ると、感染確認者数は中国に迫っています。2月には独走していた中国ですが、最近は感染確認者数があまり増加していません。一方、日本の感染確認者数は7月以降増えたため、累計値では中国に追い付いてしまいました。感染確認者数の累計では、中国と日本がほぼ同水準で、韓国が続いています。人口規模を考えると、日本の感染確認者数は、東アジアでは少なくないということになるのかもしれません。感染確認者数は、検査数次第で変動するので、国と国を比較する指標としては信頼性が低いかもしれません。では、死亡者数はどうなっているのでしょうか。死亡者数の累計では、中国、日本、韓国の順で、日本の死亡者数は中国の3分の1ほどですが、人口規模からすると、日本の死亡者数は多い、という見方もできるのかもしれません。----------------------------------------------------------------------------------------------------------------------------------------------------------------楽天市場で「マスク」を検索する楽天市場で「ポビドンヨード」を検索する楽天市場で「イソジン うがい薬」を探す楽天市場で「うがい薬」を検索する楽天市場で「マウスウォッシュ・洗口液」を探す-----------------------------------------------------------------------楽天市場で「フコイダン」を探す-----------------------------------------------------------------------AQUOS sense3 lite+Rakuten UN-LIMITプランセット(事務手数料3300円込)【22000円相当のポイント還元】価格:31280円(税別、送料別)(2020/7/15時点)楽天で購入ついに、AQUOS sense3 liteも高額ポイントの対象になりました。マイナンバーカードの読み取りに対応している機種です。----------------------------------------------------------------------------------Galaxy A7+Rakuten UN-LIMITプランセット(事務手数料3300円込)【15000円相当のポイント還元】価格:22000円(税込、送料無料) (2020/5/31時点)楽天で購入↑楽天市場店で購入すればよかったと思います:アマゾン・プライム・ビデオはHD 1080Pで視聴できます:有機ELなので、黒がきれいです:ヘッドホンでのドルビーアトモスに対応しています。-------------------------------------------------------------------------↓楽天市場以外の有名ストアの利用でも楽天ポイントが貯まります。----------------------------------------------------------------------------------------------------------------------------------------------------------------------------------------------------------------【ダッシュボード「COVID-19 Transition Graphs」を試作】こちらは、ジョンズ・ホプキンス大学のデータを利用したダッシュボードです。中国本土以外の地域への感染が拡大しているため、国別、地域別の感染者数の推移を簡単に確認できるダッシュボードを試作しています。随時、ページを追加しています。グラフのデータは、右上部分の操作でダウンロードすることができます。アメリカの「地域別の変数」を前処理して、「州別」での推移をグラフ化できるようにしました。また、州コードのフィールドを作成してコロプレス地図も作成しています。楽天ブログでは「iframe」タグが使えないので、Bloggerのページから利用できるようにしています。無料で利用できる、グーグルの「データポータル」のダッシュボードです。データさえあれば、簡単に作成できます。「国」別、「地域」別に日ごとの感染者数の推移を見ることができます。↓ダッシュボードの試作です。下記リンクのページから利用できます。ジョンズ・ホプキンス大学の「JHU CSSE」の「Covid19 Daily Reports」のデータを利用しています。 EdgeブラウザやIEブラウザなど、Chromeブラウザ以外での利用の場合はうまく表示されないことがあるようです。↓上記のダッシュボードのデータの出所のサイトです。マップがメインのダッシュボードです-----------------------------------------------------------------------------------------↓日本のインフルエンザの「定点当たり報告数」をグラフ化できるダッシュボードを試作。都道府県別にグラフ化可能です。--------------------------------------------------------------------------★おすすめの記事 ◆How Windows Sonic looks like.:Windows Sonic for Headphonesの音声と2chステレオ音声の比較:7.1.2chテストトーンの比較で明らかになった違い:一目で違いがわかりました----------------------------------------------------------------------------------------------------------
2020.10.08
コメント(0)
-

◆【nasne】なんと、ソニーの「nasne」が、バッファローの「nasne」として復活するそうです
2019年に販売終了となった、ソニーのネットワークレコーダー「nasne(ナスネ)」をバッファローが継承して、2021年春に発売するそうです。スマホ、タブレット、パソコンでテレビを楽しむのに適した「nasne」の復活は朗報と言えるでしょう。機能の「進化」があるのかどうか、注目されます。そういえば、バッファローのライバルである、I-Oデータは、独自の製品で、「nasneの後継」に名乗りをあげていましたが、バッファローは「nasne」そのものを販売するという道を選んだということになります。↓ニュースリリース↓特設ページ-----------------------------------------------------------------------------------------------------------------------------------------------------------------楽天市場で「マスク」を検索する楽天市場で「ポビドンヨード」を検索する楽天市場で「イソジン うがい薬」を探す楽天市場で「うがい薬」を検索する楽天市場で「マウスウォッシュ・洗口液」を探す-----------------------------------------------------------------------楽天市場で「フコイダン」を探す-----------------------------------------------------------------------AQUOS sense3 lite+Rakuten UN-LIMITプランセット(事務手数料3300円込)【22000円相当のポイント還元】価格:31280円(税別、送料別)(2020/7/15時点)楽天で購入ついに、AQUOS sense3 liteも高額ポイントの対象になりました。マイナンバーカードの読み取りに対応している機種です。----------------------------------------------------------------------------------Galaxy A7+Rakuten UN-LIMITプランセット(事務手数料3300円込)【15000円相当のポイント還元】価格:22000円(税込、送料無料) (2020/5/31時点)楽天で購入↑楽天市場店で購入すればよかったと思います:アマゾン・プライム・ビデオはHD 1080Pで視聴できます:有機ELなので、黒がきれいです:ヘッドホンでのドルビーアトモスに対応しています。-------------------------------------------------------------------------↓楽天市場以外の有名ストアの利用でも楽天ポイントが貯まります。----------------------------------------------------------------------------------------------------------------------------------------------------------------------------------------------------------------【ダッシュボード「COVID-19 Transition Graphs」を試作】こちらは、ジョンズ・ホプキンス大学のデータを利用したダッシュボードです。中国本土以外の地域への感染が拡大しているため、国別、地域別の感染者数の推移を簡単に確認できるダッシュボードを試作しています。随時、ページを追加しています。グラフのデータは、右上部分の操作でダウンロードすることができます。アメリカの「地域別の変数」を前処理して、「州別」での推移をグラフ化できるようにしました。また、州コードのフィールドを作成してコロプレス地図も作成しています。楽天ブログでは「iframe」タグが使えないので、Bloggerのページから利用できるようにしています。無料で利用できる、グーグルの「データポータル」のダッシュボードです。データさえあれば、簡単に作成できます。「国」別、「地域」別に日ごとの感染者数の推移を見ることができます。↓ダッシュボードの試作です。下記リンクのページから利用できます。ジョンズ・ホプキンス大学の「JHU CSSE」の「Covid19 Daily Reports」のデータを利用しています。 EdgeブラウザやIEブラウザなど、Chromeブラウザ以外での利用の場合はうまく表示されないことがあるようです。↓上記のダッシュボードのデータの出所のサイトです。マップがメインのダッシュボードです-----------------------------------------------------------------------------------------↓日本のインフルエンザの「定点当たり報告数」をグラフ化できるダッシュボードを試作。都道府県別にグラフ化可能です。--------------------------------------------------------------------------★おすすめの記事 ◆How Windows Sonic looks like.:Windows Sonic for Headphonesの音声と2chステレオ音声の比較:7.1.2chテストトーンの比較で明らかになった違い:一目で違いがわかりました----------------------------------------------------------------------------------------------------------
2020.10.07
コメント(0)
-
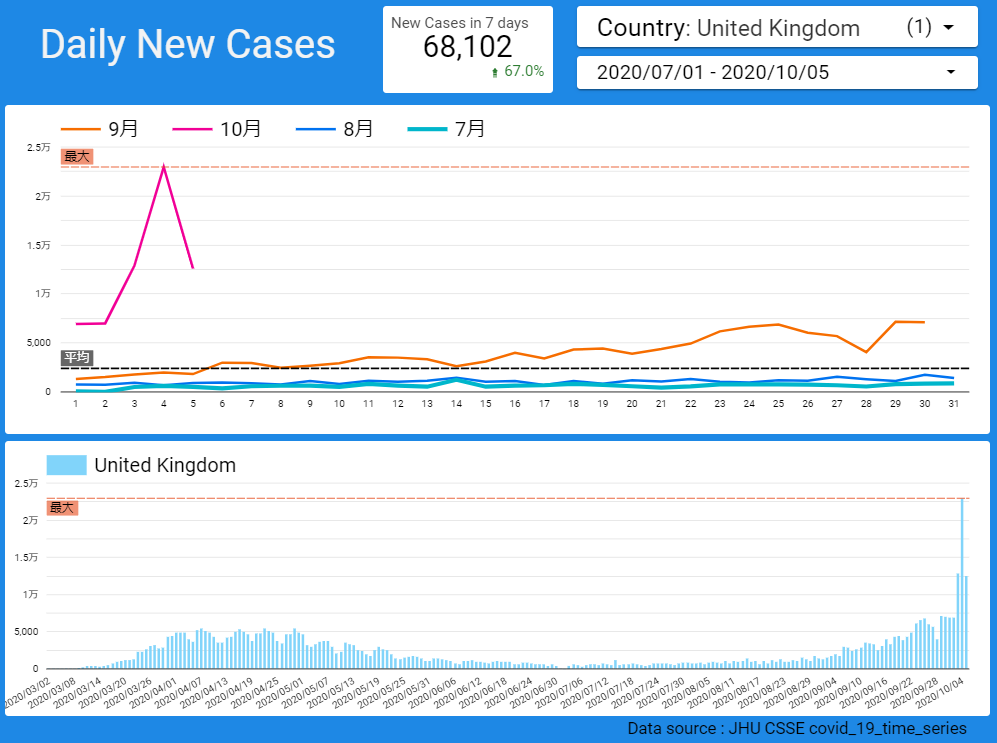
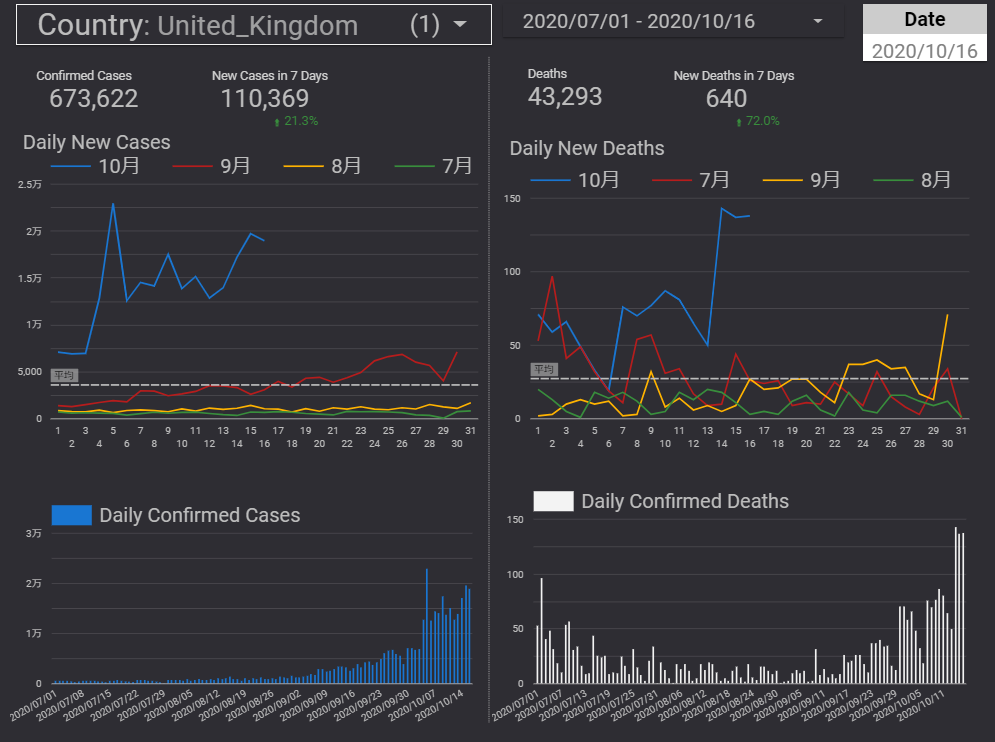
◆【新型コロナ】欧州では感染確認者数が急増中です:10月に入って加速しています
10月に入って、欧州では新型コロナの感染確認者数の増加が加速しています。↓英国では、9月から増加傾向がはっきりしていましたが、10月に入って、感染確認者数が驚くほど急増しています。直近の7日間の感染確認者数の計は、前の7日間とくらべて67%増になっています。↓フランスの場合は、感染確認者数の発表が週末は行われていないようなので、グラフが見づらいです。スペインも同じように週末の発表がありませんが、同じ欧州ですが、お国柄が英独とは異なるようです。↓英仏ほどではないですが、ドイツでも増加中です。-----------------------------------------------------------------------------------------------------------------------------------------------------------------楽天市場で「マスク」を検索する楽天市場で「ポビドンヨード」を検索する楽天市場で「イソジン うがい薬」を探す楽天市場で「うがい薬」を検索する楽天市場で「マウスウォッシュ・洗口液」を探す-----------------------------------------------------------------------楽天市場で「フコイダン」を探す-----------------------------------------------------------------------AQUOS sense3 lite+Rakuten UN-LIMITプランセット(事務手数料3300円込)【22000円相当のポイント還元】価格:31280円(税別、送料別)(2020/7/15時点)楽天で購入ついに、AQUOS sense3 liteも高額ポイントの対象になりました。マイナンバーカードの読み取りに対応している機種です。----------------------------------------------------------------------------------Galaxy A7+Rakuten UN-LIMITプランセット(事務手数料3300円込)【15000円相当のポイント還元】価格:22000円(税込、送料無料) (2020/5/31時点)楽天で購入↑楽天市場店で購入すればよかったと思います:アマゾン・プライム・ビデオはHD 1080Pで視聴できます:有機ELなので、黒がきれいです:ヘッドホンでのドルビーアトモスに対応しています。-------------------------------------------------------------------------↓楽天市場以外の有名ストアの利用でも楽天ポイントが貯まります。----------------------------------------------------------------------------------------------------------------------------------------------------------------------------------------------------------------【ダッシュボード「COVID-19 Transition Graphs」を試作】こちらは、ジョンズ・ホプキンス大学のデータを利用したダッシュボードです。中国本土以外の地域への感染が拡大しているため、国別、地域別の感染者数の推移を簡単に確認できるダッシュボードを試作しています。随時、ページを追加しています。グラフのデータは、右上部分の操作でダウンロードすることができます。アメリカの「地域別の変数」を前処理して、「州別」での推移をグラフ化できるようにしました。また、州コードのフィールドを作成してコロプレス地図も作成しています。楽天ブログでは「iframe」タグが使えないので、Bloggerのページから利用できるようにしています。無料で利用できる、グーグルの「データポータル」のダッシュボードです。データさえあれば、簡単に作成できます。「国」別、「地域」別に日ごとの感染者数の推移を見ることができます。↓ダッシュボードの試作です。下記リンクのページから利用できます。ジョンズ・ホプキンス大学の「JHU CSSE」の「Covid19 Daily Reports」のデータを利用しています。 EdgeブラウザやIEブラウザなど、Chromeブラウザ以外での利用の場合はうまく表示されないことがあるようです。↓上記のダッシュボードのデータの出所のサイトです。マップがメインのダッシュボードです-----------------------------------------------------------------------------------------↓日本のインフルエンザの「定点当たり報告数」をグラフ化できるダッシュボードを試作。都道府県別にグラフ化可能です。--------------------------------------------------------------------------★おすすめの記事 ◆How Windows Sonic looks like.:Windows Sonic for Headphonesの音声と2chステレオ音声の比較:7.1.2chテストトーンの比較で明らかになった違い:一目で違いがわかりました----------------------------------------------------------------------------------------------------------
2020.10.06
コメント(0)
-

◆【アマゾン・プライム・ビデオ】『ザ・ボーイズ シーズン2』の第7話が配信されていません:10月2日配信開始だったのに・・・:【その後、配信が再開されました】:映っていてはいけないものが映っていたのでしょうか?
過激な映像、シニカルな設定などが印象的な、アマゾン・オリジナルのドラマ『ザ・ボーイズ』ですが、そのシーズン2の第7話が配信されていません。第7話は、10月2日に配信開始だったはずなのに、現在は、第6話までしか見ることができません。配信がされていないことについて、アマゾンからアナウンスはないようです。レビューを見ると、「何か、日本では映っていてはいけないもの」が映っていたらしく、一旦、配信されたものの、配信がすぐに中断されたようです。「放送事故」ならぬ「配信事故」があった、ということのようです。でも、Netflixのオリジナル映画『ローマ』にも「日本では映っていてはいけないもの」が映っていたようですが、『ザ・ボーイズ』の配信が休止されるというのは、文芸作品とグロいドラマとの違いなのでしょうか。そう言えば、『ザ・ボーイズ』シーズン2の第6話にも「日本では映っていてはいけないようなもの」が映っていたような気がするのですが・・・。とにかく、早く、第7話を観たいです。編集作業が発生するとすれば、10月9日に第8話と一緒に配信されることになるのでしょうか。【10月5日未明にアプリを見たら、配信が再開されていました】予想よりも早く配信が再開されたのでよかったです。-----------------------------------------------------------------------------------------------------------------------------------------------------------------楽天市場で「マスク」を検索する楽天市場で「ポビドンヨード」を検索する楽天市場で「イソジン うがい薬」を探す楽天市場で「うがい薬」を検索する楽天市場で「マウスウォッシュ・洗口液」を探す-----------------------------------------------------------------------楽天市場で「フコイダン」を探す-----------------------------------------------------------------------AQUOS sense3 lite+Rakuten UN-LIMITプランセット(事務手数料3300円込)【22000円相当のポイント還元】価格:31280円(税別、送料別)(2020/7/15時点)楽天で購入ついに、AQUOS sense3 liteも高額ポイントの対象になりました。マイナンバーカードの読み取りに対応している機種です。----------------------------------------------------------------------------------Galaxy A7+Rakuten UN-LIMITプランセット(事務手数料3300円込)【15000円相当のポイント還元】価格:22000円(税込、送料無料) (2020/5/31時点)楽天で購入↑楽天市場店で購入すればよかったと思います:アマゾン・プライム・ビデオはHD 1080Pで視聴できます:有機ELなので、黒がきれいです:ヘッドホンでのドルビーアトモスに対応しています。-------------------------------------------------------------------------↓楽天市場以外の有名ストアの利用でも楽天ポイントが貯まります。----------------------------------------------------------------------------------------------------------------------------------------------------------------------------------------------------------------【ダッシュボード「COVID-19 Transition Graphs」を試作】こちらは、ジョンズ・ホプキンス大学のデータを利用したダッシュボードです。中国本土以外の地域への感染が拡大しているため、国別、地域別の感染者数の推移を簡単に確認できるダッシュボードを試作しています。随時、ページを追加しています。グラフのデータは、右上部分の操作でダウンロードすることができます。アメリカの「地域別の変数」を前処理して、「州別」での推移をグラフ化できるようにしました。また、州コードのフィールドを作成してコロプレス地図も作成しています。楽天ブログでは「iframe」タグが使えないので、Bloggerのページから利用できるようにしています。無料で利用できる、グーグルの「データポータル」のダッシュボードです。データさえあれば、簡単に作成できます。「国」別、「地域」別に日ごとの感染者数の推移を見ることができます。↓ダッシュボードの試作です。下記リンクのページから利用できます。ジョンズ・ホプキンス大学の「JHU CSSE」の「Covid19 Daily Reports」のデータを利用しています。 EdgeブラウザやIEブラウザなど、Chromeブラウザ以外での利用の場合はうまく表示されないことがあるようです。↓上記のダッシュボードのデータの出所のサイトです。マップがメインのダッシュボードです-----------------------------------------------------------------------------------------↓日本のインフルエンザの「定点当たり報告数」をグラフ化できるダッシュボードを試作。都道府県別にグラフ化可能です。--------------------------------------------------------------------------★おすすめの記事 ◆How Windows Sonic looks like.:Windows Sonic for Headphonesの音声と2chステレオ音声の比較:7.1.2chテストトーンの比較で明らかになった違い:一目で違いがわかりました----------------------------------------------------------------------------------------------------------
2020.10.04
コメント(0)
-

◆【東証売買停止】市場は開いたが、すべての売買を停止したそうです:ということで、休場ではありません
東京証券取引所の記者会見を見ましたが、10月1日に東京証券取引所は、取引市場を開いたそうです。しかし、システムトラブルのため、すべての売買を停止したそうです。というより、売買は一切成立していないそうです。売買をすべて停止し、売買は一つも成立していないけれども、「市場は開いた」という奇妙な話をする理由は何なのでしょうか。勝手に「休場」はできないからでしょうか。でも、事実上の「休場」以外のなにものでもないと思うのですが。「市場を開いた」ことにしなければならない理由を説明してほしかったです。機器の故障であれば、切り替えて取引を開始できたのかもしれません。しかし、混乱が起きた場合の損害賠償などを恐れて終日売買停止にしたのではないかと思います。「売買停止」「再開なし」は、事なかれ主義による選択だったようです。何兆円もの取引ができなくなっても、だれも何の責任もとらず、「申し訳ありませんでした。お詫びします」で済ませることができるようです。でも、「申し訳ありません」で済むのであれば、金融庁なんか不要ということになってしまいます。これで、何のペナルティもなしで済むのであれば、再発防止のためにサーバーを増強する方向には動かないと思います。金融庁、あるいは第3者機関が立ち入り検査をするのであれば別かもしれませんが、むしろ、安定稼働のための投資をケチる方向に進むのではないでしょうか。そう言えば、東証は、金融庁からの天下りを受け入れてきたのですから、金融庁の監督機能などもまったく期待できないのではないでしょうか。仮に、金融庁が立ち入り検査をしたとしても、検査内容を信用することはできないでしょう。監督官庁から監督対象企業への天下りなどは、あってはならないはずですが、実際には横行している日本社会ですから、闇は深そうです。合理的な思考をするならば、「申し訳ありませんでした」と、ひとこと言う方がサーバーへの投資よりも格段に安価です。金融庁からの天下りの受け入れを増やす方が、低コストでしょう。バックアップ機などなくしてしまって、コストカットして、サーバーがダウンした時には、「なぜかバックアップ機に切り替えができなかった」と言えば済みます。「申し訳ありません」で済むのであれば、もはや、バックアップ機への投資は不要になっているということなのかもしれません。今回の事故も、せいぜい、システム担当役員が更迭されて終わりでしょう。そもそも、本当にバックアップ機は存在していたのでしょうか。セキュリティ上の理由などから、システムの詳細を明らかにすることはないでしょうから、バックアップ機能がなくても誰にもわからないのではないでしょうか。「セキュリティにかかわる企業機密なので、サーバーのシステム構成の詳細は言えません」と言われてしまえば、バックアップ系の存在を確認することは困難です。書類上は存在しているのかもしれませんが、まさに、文字通り「仮想的なバックアップサーバー」なのかもしれません。そもそも、「売買成立がゼロ件」なのに、「市場を開きました」などと強弁する企業の言うことは信用できないのではないかと思います。しかし、JPXのページにも表示されていますが、10月1日の日経平均株価は、23,184.93円で、-0.19円となっています。前日比-0.19円ということなので、少し売買が成立しているようです。どうやら、市場外取引の結果のようですが、これが、「市場を開いた」と言っている根拠なのでしょうか。ハードウェアの障害で、バックアップ系への切り替えもできなかったそうですが、10月1日というキリのいい日に故障するものなのでしょうか。満月が近づくと、何かが起きることが多いのかもしれませんが。サイバーテロとかの可能性はないのでしょうか。やはり、単にサーバーへの投資をケチっているからでしょうか。「冗長性がない」ということは、「ケチっている」ということなのだと思います。サーバーが2機あったとしても、その2機を同時期に導入していたりすると、部品の経年劣化による故障などは同時期に発生したりするので、バックアップの意味がなかったりします。日頃、バックアップ機への切り替えテストなどを本当に実施しているのでしょうか。機能しないバックアップ機は、存在しないのと等しいと思いますが、本当に「存在していない」のかもしれません。【その後の続報によると、「メモリが故障し、バックアップに切り替わるはずが、設定に不備があったため、切り替わらなかった」ということだそうです。「設定の不備」ということは、バックアップへの切り替え訓練などをしていないようです。】いずれにしても、このような失態から、IT後進国、デジタル後進国と言われる理由は、政府機関のデジタル化の遅れによるものだけではないことがわかります。資本主義社会のインフラが、いとも簡単に機能不全を起こすというのでは、「IT後進国」と言われても仕方がなさそうです。IT後進国なら、後進国らしく、人海戦術で取引を成立させてほしかったです。サーバーや通信機器に頼らないアナログ環境で取引ができれば、サイバーテロとは無縁で、ある意味で「最強の取引システム」ということになるかもしれません。-----------------------------------------------------------------------------------------------------------------------------------------------------------------楽天市場で「マスク」を検索する楽天市場で「ポビドンヨード」を検索する楽天市場で「イソジン うがい薬」を探す楽天市場で「うがい薬」を検索する楽天市場で「マウスウォッシュ・洗口液」を探す-----------------------------------------------------------------------楽天市場で「フコイダン」を探す-----------------------------------------------------------------------AQUOS sense3 lite+Rakuten UN-LIMITプランセット(事務手数料3300円込)【22000円相当のポイント還元】価格:31280円(税別、送料別)(2020/7/15時点)楽天で購入ついに、AQUOS sense3 liteも高額ポイントの対象になりました。マイナンバーカードの読み取りに対応している機種です。----------------------------------------------------------------------------------Galaxy A7+Rakuten UN-LIMITプランセット(事務手数料3300円込)【15000円相当のポイント還元】価格:22000円(税込、送料無料) (2020/5/31時点)楽天で購入↑楽天市場店で購入すればよかったと思います:アマゾン・プライム・ビデオはHD 1080Pで視聴できます:有機ELなので、黒がきれいです:ヘッドホンでのドルビーアトモスに対応しています。-------------------------------------------------------------------------↓楽天市場以外の有名ストアの利用でも楽天ポイントが貯まります。----------------------------------------------------------------------------------------------------------------------------------------------------------------------------------------------------------------【ダッシュボード「COVID-19 Transition Graphs」を試作】こちらは、ジョンズ・ホプキンス大学のデータを利用したダッシュボードです。中国本土以外の地域への感染が拡大しているため、国別、地域別の感染者数の推移を簡単に確認できるダッシュボードを試作しています。随時、ページを追加しています。グラフのデータは、右上部分の操作でダウンロードすることができます。アメリカの「地域別の変数」を前処理して、「州別」での推移をグラフ化できるようにしました。また、州コードのフィールドを作成してコロプレス地図も作成しています。楽天ブログでは「iframe」タグが使えないので、Bloggerのページから利用できるようにしています。無料で利用できる、グーグルの「データポータル」のダッシュボードです。データさえあれば、簡単に作成できます。「国」別、「地域」別に日ごとの感染者数の推移を見ることができます。↓ダッシュボードの試作です。下記リンクのページから利用できます。ジョンズ・ホプキンス大学の「JHU CSSE」の「Covid19 Daily Reports」のデータを利用しています。 EdgeブラウザやIEブラウザなど、Chromeブラウザ以外での利用の場合はうまく表示されないことがあるようです。↓上記のダッシュボードのデータの出所のサイトです。マップがメインのダッシュボードです-----------------------------------------------------------------------------------------↓日本のインフルエンザの「定点当たり報告数」をグラフ化できるダッシュボードを試作。都道府県別にグラフ化可能です。--------------------------------------------------------------------------★おすすめの記事 ◆How Windows Sonic looks like.:Windows Sonic for Headphonesの音声と2chステレオ音声の比較:7.1.2chテストトーンの比較で明らかになった違い:一目で違いがわかりました----------------------------------------------------------------------------------------------------------
2020.10.01
コメント(0)
-
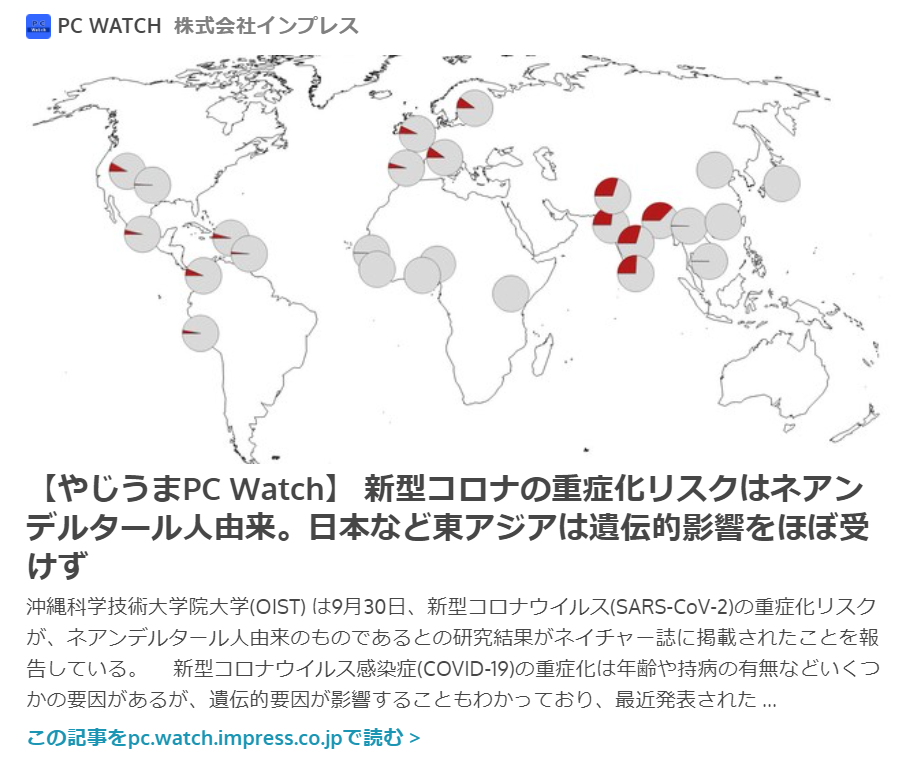
◆【新型コロナ】「ファクターX」の一部はネアンデルタール人の遺伝子?:ネアンデルタール人の遺伝子が重症化リスクと関係あり?
新型コロナウイルス感染症による死亡者数が、欧米などと比べて、日本など東アジアで少ない傾向にある理由は謎とされていますが、重症化リスクとネアンデルタール人の遺伝子が関係しているのではないか、という説が出てきました。新型コロナの重症化に関連している遺伝子がネアンデルタール人由来のものらしい、ということのようです。そして、南アジアや欧米では、ネアンデルタール人の遺伝子を持つ人が多いのに対して、東アジアにはその遺伝子を持つ人がほとんどいないそうです。確かに、この説は南アジアやヨーロッパなどで死亡者数が多いという事実と符合します。約4~6万年前の人類の歴史上の出来事と新型コロナの重症化リスクとが関連しているという説は、非常に興味深いと思います。『nature』誌から(Google翻訳です)概要最近の遺伝子関連研究1は、重症急性呼吸器症候群コロナウイルス2(SARS-CoV-2)に感染した後の呼吸不全のリスク遺伝子座として、染色体3上の遺伝子クラスターを特定しました。2019年コロナウイルス感染症の入院患者3,199人(COVID-19)と対照者を含む別の研究(COVID-19 Host Genetics Initiative)2は、このクラスターがSARS-CoV-2感染および入院後の重篤な症状の主要な遺伝的危険因子であることを示しました。ここでは、ネアンデルタール人から受け継がれ、南アジアの人々の約50%、ヨーロッパの人々の約16%が担っている、サイズが約50キロベースのゲノムセグメントによってリスクがもたらされることを示します。-----------------------------------------------------------------------------------------------------------------------------------------------------------------楽天市場で「マスク」を検索する楽天市場で「ポビドンヨード」を検索する楽天市場で「イソジン うがい薬」を探す楽天市場で「うがい薬」を検索する楽天市場で「マウスウォッシュ・洗口液」を探す-----------------------------------------------------------------------楽天市場で「フコイダン」を探す-----------------------------------------------------------------------AQUOS sense3 lite+Rakuten UN-LIMITプランセット(事務手数料3300円込)【22000円相当のポイント還元】価格:31280円(税別、送料別)(2020/7/15時点)楽天で購入ついに、AQUOS sense3 liteも高額ポイントの対象になりました。マイナンバーカードの読み取りに対応している機種です。----------------------------------------------------------------------------------Galaxy A7+Rakuten UN-LIMITプランセット(事務手数料3300円込)【15000円相当のポイント還元】価格:22000円(税込、送料無料) (2020/5/31時点)楽天で購入↑楽天市場店で購入すればよかったと思います:アマゾン・プライム・ビデオはHD 1080Pで視聴できます:有機ELなので、黒がきれいです:ヘッドホンでのドルビーアトモスに対応しています。-------------------------------------------------------------------------↓楽天市場以外の有名ストアの利用でも楽天ポイントが貯まります。----------------------------------------------------------------------------------------------------------------------------------------------------------------------------------------------------------------【ダッシュボード「COVID-19 Transition Graphs」を試作】こちらは、ジョンズ・ホプキンス大学のデータを利用したダッシュボードです。中国本土以外の地域への感染が拡大しているため、国別、地域別の感染者数の推移を簡単に確認できるダッシュボードを試作しています。随時、ページを追加しています。グラフのデータは、右上部分の操作でダウンロードすることができます。アメリカの「地域別の変数」を前処理して、「州別」での推移をグラフ化できるようにしました。また、州コードのフィールドを作成してコロプレス地図も作成しています。楽天ブログでは「iframe」タグが使えないので、Bloggerのページから利用できるようにしています。無料で利用できる、グーグルの「データポータル」のダッシュボードです。データさえあれば、簡単に作成できます。「国」別、「地域」別に日ごとの感染者数の推移を見ることができます。↓ダッシュボードの試作です。下記リンクのページから利用できます。ジョンズ・ホプキンス大学の「JHU CSSE」の「Covid19 Daily Reports」のデータを利用しています。 EdgeブラウザやIEブラウザなど、Chromeブラウザ以外での利用の場合はうまく表示されないことがあるようです。↓上記のダッシュボードのデータの出所のサイトです。マップがメインのダッシュボードです-----------------------------------------------------------------------------------------↓日本のインフルエンザの「定点当たり報告数」をグラフ化できるダッシュボードを試作。都道府県別にグラフ化可能です。--------------------------------------------------------------------------★おすすめの記事 ◆How Windows Sonic looks like.:Windows Sonic for Headphonesの音声と2chステレオ音声の比較:7.1.2chテストトーンの比較で明らかになった違い:一目で違いがわかりました----------------------------------------------------------------------------------------------------------
2020.10.01
コメント(0)
-

◆【新型コロナ】累計死亡者数が100万人を超えました:日本の死亡者数は1500人超
ニュースなどでも報じられていますが、ジョンズ・ホプキンス大学が公表した9月28日付の世界のデータによると、新型コロナウイルス感染症による死亡者数が100万人を超えました。感染についての検査をされなかった死亡者もいるはずですから、実際にはもっと多いと考えられます。4月頃には、日本だけで死亡者が40万人くらいになるかもしれない、とか言われていましたが、日本の死亡者数は今のところ、約1500人です。日本では、「予測」との違いが大きすぎて驚きます。結果論になってしまいますが、日本の場合は、緊急事態宣言によって社会経済活動を抑制し過ぎたことは間違いなさそうです。世界の死亡者数は、1週間に約37000人で、1日あたりでは5000人を超えています。死亡者数は、最近は横ばいで推移しているようです。↓こちらは、ECDCのデータを利用したダッシュボードです。ECDCのデータでは、まだ100万人に達していません。-----------------------------------------------------------------------------------------------------------------------------------------------------------------楽天市場で「マスク」を検索する楽天市場で「ポビドンヨード」を検索する楽天市場で「イソジン うがい薬」を探す楽天市場で「うがい薬」を検索する楽天市場で「マウスウォッシュ・洗口液」を探す-----------------------------------------------------------------------楽天市場で「フコイダン」を探す-----------------------------------------------------------------------AQUOS sense3 lite+Rakuten UN-LIMITプランセット(事務手数料3300円込)【22000円相当のポイント還元】価格:31280円(税別、送料別)(2020/7/15時点)楽天で購入ついに、AQUOS sense3 liteも高額ポイントの対象になりました。マイナンバーカードの読み取りに対応している機種です。----------------------------------------------------------------------------------Galaxy A7+Rakuten UN-LIMITプランセット(事務手数料3300円込)【15000円相当のポイント還元】価格:22000円(税込、送料無料) (2020/5/31時点)楽天で購入↑楽天市場店で購入すればよかったと思います:アマゾン・プライム・ビデオはHD 1080Pで視聴できます:有機ELなので、黒がきれいです:ヘッドホンでのドルビーアトモスに対応しています。-------------------------------------------------------------------------↓楽天市場以外の有名ストアの利用でも楽天ポイントが貯まります。----------------------------------------------------------------------------------------------------------------------------------------------------------------------------------------------------------------【ダッシュボード「COVID-19 Transition Graphs」を試作】こちらは、ジョンズ・ホプキンス大学のデータを利用したダッシュボードです。中国本土以外の地域への感染が拡大しているため、国別、地域別の感染者数の推移を簡単に確認できるダッシュボードを試作しています。随時、ページを追加しています。グラフのデータは、右上部分の操作でダウンロードすることができます。アメリカの「地域別の変数」を前処理して、「州別」での推移をグラフ化できるようにしました。また、州コードのフィールドを作成してコロプレス地図も作成しています。楽天ブログでは「iframe」タグが使えないので、Bloggerのページから利用できるようにしています。無料で利用できる、グーグルの「データポータル」のダッシュボードです。データさえあれば、簡単に作成できます。「国」別、「地域」別に日ごとの感染者数の推移を見ることができます。↓ダッシュボードの試作です。下記リンクのページから利用できます。ジョンズ・ホプキンス大学の「JHU CSSE」の「Covid19 Daily Reports」のデータを利用しています。 EdgeブラウザやIEブラウザなど、Chromeブラウザ以外での利用の場合はうまく表示されないことがあるようです。↓上記のダッシュボードのデータの出所のサイトです。マップがメインのダッシュボードです-----------------------------------------------------------------------------------------↓日本のインフルエンザの「定点当たり報告数」をグラフ化できるダッシュボードを試作。都道府県別にグラフ化可能です。--------------------------------------------------------------------------★おすすめの記事 ◆How Windows Sonic looks like.:Windows Sonic for Headphonesの音声と2chステレオ音声の比較:7.1.2chテストトーンの比較で明らかになった違い:一目で違いがわかりました----------------------------------------------------------------------------------------------------------
2020.09.30
コメント(0)
-
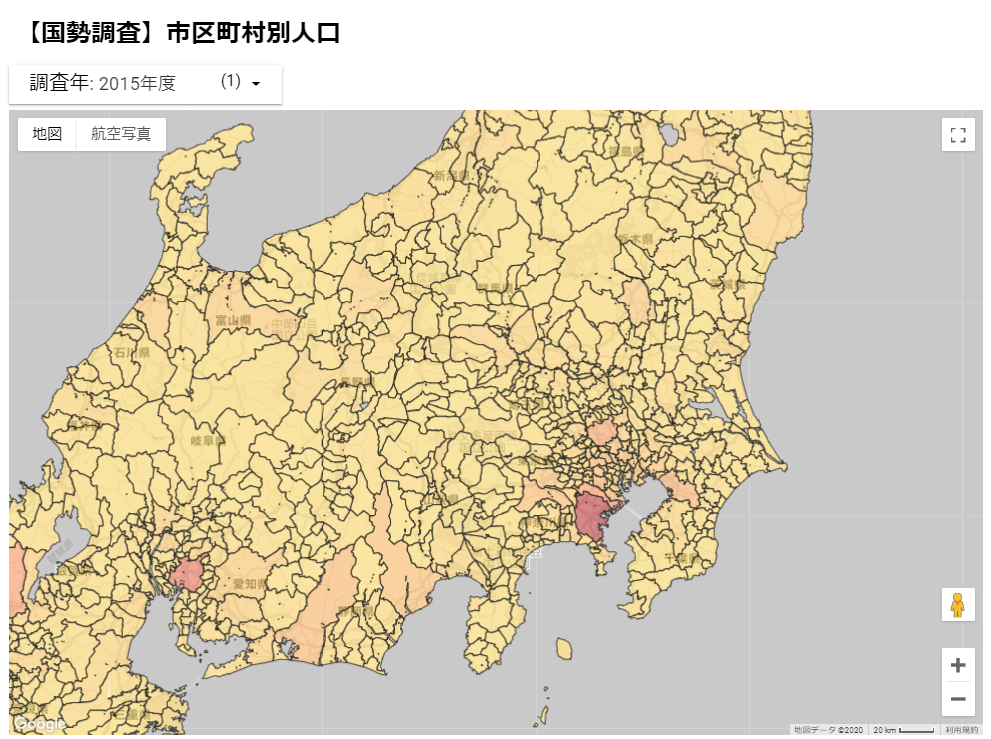
◆【データポータル】国勢調査の人口統計を塗り分け地図にしてみました:一部の市町村が地図に表示されませんでしたが、なんとか対処できました
今年は国勢調査年ということで、国勢調査のデータをデータポータルの地図に表示してみました。非常に惜しいのですが、地図上で塗り分けがなく、白く表示されているところがいくつかありました。上の地図は、対処済みのものです。市区町村名は、日本語表記のデータを用いましたが、福島県柳津町や茨城県石岡市、埼玉県横瀬町、香川県小豆島町など、一部の市町村のデータが表示されていません。これは、再現性がある現象なのか、あるいは私のパソコン環境などによる、再現性がないものなのかは不明ですが、エラーが生じることはあるようです。埼玉県横瀬町の場合は、「埼玉県秩父郡横瀬町」とすることで、描画されました。福島県柳津町は「yanaizu」、茨城県石岡市は「ishioka」とローマ字表記にすることで描画されました。香川県小豆島町は、「香川県小豆郡小豆島町」とすることで、描画されました。地図上にマウスオバーさせた時に表示される名称の表記に統一性はなくなりますが、データが表示されないよりはましです。もしかすると、他にも描画されていない部分があるのかもしれませんが、上記のような方法で対処できるのではないかと思います。-----------------------------------------------------------------------------------------------------------------------------------------------------------------楽天市場で「マスク」を検索する楽天市場で「ポビドンヨード」を検索する楽天市場で「イソジン うがい薬」を探す楽天市場で「うがい薬」を検索する楽天市場で「マウスウォッシュ・洗口液」を探す-----------------------------------------------------------------------楽天市場で「フコイダン」を探す-----------------------------------------------------------------------AQUOS sense3 lite+Rakuten UN-LIMITプランセット(事務手数料3300円込)【22000円相当のポイント還元】価格:31280円(税別、送料別)(2020/7/15時点)楽天で購入ついに、AQUOS sense3 liteも高額ポイントの対象になりました。マイナンバーカードの読み取りに対応している機種です。----------------------------------------------------------------------------------Galaxy A7+Rakuten UN-LIMITプランセット(事務手数料3300円込)【15000円相当のポイント還元】価格:22000円(税込、送料無料) (2020/5/31時点)楽天で購入↑楽天市場店で購入すればよかったと思います:アマゾン・プライム・ビデオはHD 1080Pで視聴できます:有機ELなので、黒がきれいです:ヘッドホンでのドルビーアトモスに対応しています。-------------------------------------------------------------------------↓楽天市場以外の有名ストアの利用でも楽天ポイントが貯まります。----------------------------------------------------------------------------------------------------------------------------------------------------------------------------------------------------------------【ダッシュボード「COVID-19 Transition Graphs」を試作】こちらは、ジョンズ・ホプキンス大学のデータを利用したダッシュボードです。中国本土以外の地域への感染が拡大しているため、国別、地域別の感染者数の推移を簡単に確認できるダッシュボードを試作しています。随時、ページを追加しています。グラフのデータは、右上部分の操作でダウンロードすることができます。アメリカの「地域別の変数」を前処理して、「州別」での推移をグラフ化できるようにしました。また、州コードのフィールドを作成してコロプレス地図も作成しています。楽天ブログでは「iframe」タグが使えないので、Bloggerのページから利用できるようにしています。無料で利用できる、グーグルの「データポータル」のダッシュボードです。データさえあれば、簡単に作成できます。「国」別、「地域」別に日ごとの感染者数の推移を見ることができます。↓ダッシュボードの試作です。下記リンクのページから利用できます。ジョンズ・ホプキンス大学の「JHU CSSE」の「Covid19 Daily Reports」のデータを利用しています。 EdgeブラウザやIEブラウザなど、Chromeブラウザ以外での利用の場合はうまく表示されないことがあるようです。↓上記のダッシュボードのデータの出所のサイトです。マップがメインのダッシュボードです-----------------------------------------------------------------------------------------↓日本のインフルエンザの「定点当たり報告数」をグラフ化できるダッシュボードを試作。都道府県別にグラフ化可能です。--------------------------------------------------------------------------★おすすめの記事 ◆How Windows Sonic looks like.:Windows Sonic for Headphonesの音声と2chステレオ音声の比較:7.1.2chテストトーンの比較で明らかになった違い:一目で違いがわかりました----------------------------------------------------------------------------------------------------------
2020.09.28
コメント(0)
-
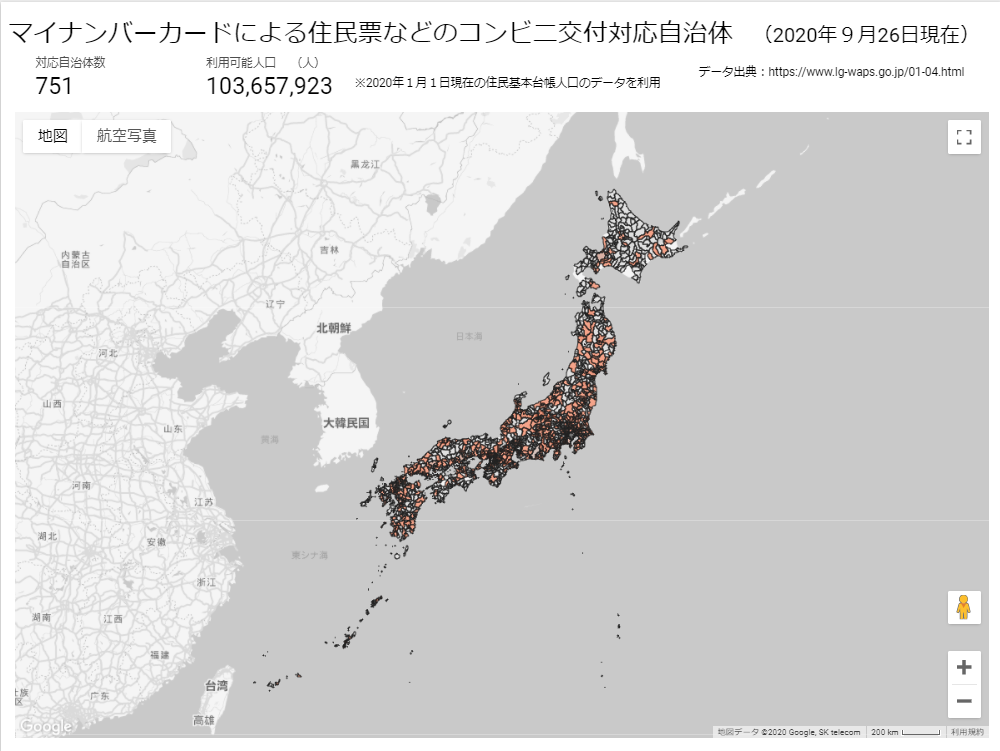
◆【データポータル】地図機能が進化中です:「都道府県名+市区町村名」の変数があれば市区町村別塗り分け地図ができます
グーグルのデータポータルの地図機能が進化しているようです。データポータルは、グーグルアカウントがあれば利用できるサービスです。データポータルでは、グーグルアナリティクスのデータなど、異なるデータを組み合わせてレポートを作成できるので、地図機能の活用範囲は広いと思います。地図作成の際の市区町村の指定は、「愛知県名古屋市」や「東京都八王子市」のように「都道府県名市区町村名」の文字列で可能です。なお、市区町村名だけで指定すると、「伊達市」のように北海道や福島県など、複数の県に同名の自治体がある場合に不具合が生じてしまいます。本当は、自治体のJISコードが使えると便利なのですが、グーグルのデータポータルの塗り分け地図では、日本の自治体のJISコードには対応していません。JISコードを利用して地図を作成しようとすると、世界地図上にプロットされてしまいます。地図では、地域コードは、グーグル独自のものが使われています。地図上では、市区町村の境界が整備されていますが、グーグルの公開している地域コードには市区町村の一部しか含まれていません。なお、「区」のレベルの塗り分けができるのは、東京都だけです。横浜市や大阪市、名古屋市などは「区」があっても「市」単位の塗り分けになります。また、塗り分け可能数が2000までなので、「市区郡町村」のように「郡全体」の行を含むデータだと、福岡県までで塗り分けが終了してしまいました。「市区町村」のデータにする必要があるようです。以上のような制約もありますが、とりあえずデータポータルの地図機能を使って、マイナンバーカードを利用して住民票などをコンビニで交付するサービスを提供している市区町村の地図を作成してみました。全国的には、マイナンバーカードによる住民票などのコンビニ交付に対応していない自治体の方が多いというのが現状です。大都市圏でも、名古屋市とその周辺の市や八王子市などは非対応だったりします。ただし、コンビニ交付を利用可能な人口は1億人を超えていて、利用できる人は多いと言えます。データポータル内で、コンビニ交付自治体であることを示す「1」と人口データを掛け合わせて、利用可能人口を計算しています。人口のデータは、住民基本台帳人口を利用しています。新しいフィールドの作成メニューで計算式を入れるとカスタム指標を作成できます。↓「階級別に細かく塗り分けの色を指定する」ということができない点は残念ですが、下図のような「サービスの有り無し」のような単純な塗り分けであれば十分使えます。ズームイン、ズームアウトも簡単です。住民基本台帳人口のデータと組み合わせると、データポータルでコンビニ交付利用可能人口を計算して表示させることもできます。-----------------------------------------------------------------------------------------------------------------------------------------------------------------楽天市場で「マスク」を検索する楽天市場で「ポビドンヨード」を検索する楽天市場で「イソジン うがい薬」を探す楽天市場で「うがい薬」を検索する楽天市場で「マウスウォッシュ・洗口液」を探す-----------------------------------------------------------------------楽天市場で「フコイダン」を探す-----------------------------------------------------------------------AQUOS sense3 lite+Rakuten UN-LIMITプランセット(事務手数料3300円込)【22000円相当のポイント還元】価格:31280円(税別、送料別)(2020/7/15時点)楽天で購入ついに、AQUOS sense3 liteも高額ポイントの対象になりました。マイナンバーカードの読み取りに対応している機種です。----------------------------------------------------------------------------------Galaxy A7+Rakuten UN-LIMITプランセット(事務手数料3300円込)【15000円相当のポイント還元】価格:22000円(税込、送料無料) (2020/5/31時点)楽天で購入↑楽天市場店で購入すればよかったと思います:アマゾン・プライム・ビデオはHD 1080Pで視聴できます:有機ELなので、黒がきれいです:ヘッドホンでのドルビーアトモスに対応しています。-------------------------------------------------------------------------↓楽天市場以外の有名ストアの利用でも楽天ポイントが貯まります。----------------------------------------------------------------------------------------------------------------------------------------------------------------------------------------------------------------【ダッシュボード「COVID-19 Transition Graphs」を試作】こちらは、ジョンズ・ホプキンス大学のデータを利用したダッシュボードです。中国本土以外の地域への感染が拡大しているため、国別、地域別の感染者数の推移を簡単に確認できるダッシュボードを試作しています。随時、ページを追加しています。グラフのデータは、右上部分の操作でダウンロードすることができます。アメリカの「地域別の変数」を前処理して、「州別」での推移をグラフ化できるようにしました。また、州コードのフィールドを作成してコロプレス地図も作成しています。楽天ブログでは「iframe」タグが使えないので、Bloggerのページから利用できるようにしています。無料で利用できる、グーグルの「データポータル」のダッシュボードです。データさえあれば、簡単に作成できます。「国」別、「地域」別に日ごとの感染者数の推移を見ることができます。↓ダッシュボードの試作です。下記リンクのページから利用できます。ジョンズ・ホプキンス大学の「JHU CSSE」の「Covid19 Daily Reports」のデータを利用しています。 EdgeブラウザやIEブラウザなど、Chromeブラウザ以外での利用の場合はうまく表示されないことがあるようです。↓上記のダッシュボードのデータの出所のサイトです。マップがメインのダッシュボードです-----------------------------------------------------------------------------------------↓日本のインフルエンザの「定点当たり報告数」をグラフ化できるダッシュボードを試作。都道府県別にグラフ化可能です。--------------------------------------------------------------------------★おすすめの記事 ◆How Windows Sonic looks like.:Windows Sonic for Headphonesの音声と2chステレオ音声の比較:7.1.2chテストトーンの比較で明らかになった違い:一目で違いがわかりました----------------------------------------------------------------------------------------------------------
2020.09.27
コメント(0)
-
◆【マイナンバーカード】なんと、名古屋市は住民票などのコンビニ交付に非対応:住民票などのコンビニ交付に対応していない自治体の方が多いという現実
新型コロナウイルス関連の給付金申請などで、日本の行政のデジタル化が遅れていることが改めて明らかになっています。マイナンバーカードの普及促進のために、マイナポイントキャンペーンが行われていたりしますが、マイナンバーカードを取得しても、住民票のコンビニ交付のサービスなどを受けられない自治体の数は、サービスを受けられる自治体の数よりも多いという現実があります。ただし、サービスを受けれられない自治体のほとんどは比較的小規模な自治体なので、サービスを受けられる人口は、約1億人と多くなっています。2020年9月現在で、マイナンバーカードによるコンビニ交付サービスを提供している自治体は751市区町村です。全国の市区町村1741のうち、コンビニ交付対応自治体は751で、43%に過ぎません。過半数の990の自治体では住民票のコンビニ交付に対応していません。現在のサービス提供市区町村 751市区町村(2020年9月26日現在)↓グーグルのデータポータルを利用して、マイナンバーカードによる住民票などのコンビニ交付対応の自治体を地図上にプロットしてみました。大都市圏では対応自治体が多いことがわかります。市区町村名だけでプロットできましたが、同じ名前の自治体の場合は不具合が生じています。この場合は、「北海道伊達市」「福島県伊達市」のように「都道府県名市区町村名」の形式にすればよいことがわかりました。グーグルがJISの市区町村コードに対応していれば、対応が簡単なのですが。なお、グーグルの独自の地域コードには合併前の自治体があったりして、古いデータのようです。とはいえ、データポータルの地図機能が進化していて、塗り分け地図が簡単にできるようになっています。ただし、「区」レベルの表示は、東京23区だけで、横浜市や大阪市などは「市単位」での表示になっています。↓上の地図で名古屋市が含まれていなかったので、何かの間違いなのではないかと思って調べてみると、確かに名古屋市はコンビニ交付には対応していませんでした。名古屋市のような大都市が非対応というのは、驚きでした。名古屋市民は、マイナポイントはもらえますが、現状では、コンビニ交付サービスは使えない、ということになります。名古屋市周辺の市も非対応のところが多くなっています。でも、県庁所在地が非対応なのに、同じ愛知県内でも、コンビニ交付に対応している市区町村があるのは興味深いと思います。しかし、コンビニのコピー機で住民票を印刷できるのが便利だという感覚が古いのかもしれません。紙の住民票などが不要になる社会を目指すべきなのでしょう。もしかすると、名古屋市は、いろいろな手続きに住民票が必要でなくなる時代を見据えているのかもしれません。そもそも、市区町村ごとにシステムが異なっていたりして、行政のデジタル化は簡単にできることではなさそうです。「デジタル庁新設」という掛け声も聞こえてきましたが、「確定申告をインターネットでできるのに、市区町村向けの所得申告はネットではできない」といった意味不明な状況を放置してきた国と地方自治体ですから、短期的には何も期待することはできないと思います。デジタル庁のような組織を作っても、各省庁のシステム部門がそのまま残っていては何も変わらないでしょう。各省庁や地方自治体のシステム部門をすべて統合・統括する組織ができないと何も進まないと思います。これまで、デジタル化の成果を挙げることができなかった理由の洗い出し、政府の反省点をまず明らかにしてもらいたいと思います。官僚組織の中には「デジタル化のインセンティブ」がないということなのでしょうが、「なぜ、デジタル化が進まなかったのか、進めなかったのか」を明らかにすることが最大の課題なのではないでしょうか。行政のデジタル化には5年~10年単位の時間がかかるのでしょうから、2年~3年で異動するキャリア官僚にとっては、取り組みたくない課題なのではないでしょうか。ところで、イオンの電子マネーのワオンでのマイナポントの付与は、チャージから1カ月後になるようです。例えば、9月にチャージした分のマイナポイントは10月末に付与されるようです。すべて、デジタル処理のはずなのに、なぜ、1カ月もかかるのでしょうか。チャージの情報を紙にプリントアウトして処理しているのでしょうか。-----------------------------------------------------------------------------------------------------------------------------------------------------------------楽天市場で「マスク」を検索する楽天市場で「ポビドンヨード」を検索する楽天市場で「イソジン うがい薬」を探す楽天市場で「うがい薬」を検索する楽天市場で「マウスウォッシュ・洗口液」を探す-----------------------------------------------------------------------楽天市場で「フコイダン」を探す-----------------------------------------------------------------------AQUOS sense3 lite+Rakuten UN-LIMITプランセット(事務手数料3300円込)【22000円相当のポイント還元】価格:31280円(税別、送料別)(2020/7/15時点)楽天で購入ついに、AQUOS sense3 liteも高額ポイントの対象になりました。マイナンバーカードの読み取りに対応している機種です。----------------------------------------------------------------------------------Galaxy A7+Rakuten UN-LIMITプランセット(事務手数料3300円込)【15000円相当のポイント還元】価格:22000円(税込、送料無料) (2020/5/31時点)楽天で購入↑楽天市場店で購入すればよかったと思います:アマゾン・プライム・ビデオはHD 1080Pで視聴できます:有機ELなので、黒がきれいです:ヘッドホンでのドルビーアトモスに対応しています。-------------------------------------------------------------------------↓楽天市場以外の有名ストアの利用でも楽天ポイントが貯まります。----------------------------------------------------------------------------------------------------------------------------------------------------------------------------------------------------------------【ダッシュボード「COVID-19 Transition Graphs」を試作】こちらは、ジョンズ・ホプキンス大学のデータを利用したダッシュボードです。中国本土以外の地域への感染が拡大しているため、国別、地域別の感染者数の推移を簡単に確認できるダッシュボードを試作しています。随時、ページを追加しています。グラフのデータは、右上部分の操作でダウンロードすることができます。アメリカの「地域別の変数」を前処理して、「州別」での推移をグラフ化できるようにしました。また、州コードのフィールドを作成してコロプレス地図も作成しています。楽天ブログでは「iframe」タグが使えないので、Bloggerのページから利用できるようにしています。無料で利用できる、グーグルの「データポータル」のダッシュボードです。データさえあれば、簡単に作成できます。「国」別、「地域」別に日ごとの感染者数の推移を見ることができます。↓ダッシュボードの試作です。下記リンクのページから利用できます。ジョンズ・ホプキンス大学の「JHU CSSE」の「Covid19 Daily Reports」のデータを利用しています。 EdgeブラウザやIEブラウザなど、Chromeブラウザ以外での利用の場合はうまく表示されないことがあるようです。↓上記のダッシュボードのデータの出所のサイトです。マップがメインのダッシュボードです-----------------------------------------------------------------------------------------↓日本のインフルエンザの「定点当たり報告数」をグラフ化できるダッシュボードを試作。都道府県別にグラフ化可能です。--------------------------------------------------------------------------★おすすめの記事 ◆How Windows Sonic looks like.:Windows Sonic for Headphonesの音声と2chステレオ音声の比較:7.1.2chテストトーンの比較で明らかになった違い:一目で違いがわかりました----------------------------------------------------------------------------------------------------------
2020.09.26
コメント(0)
-
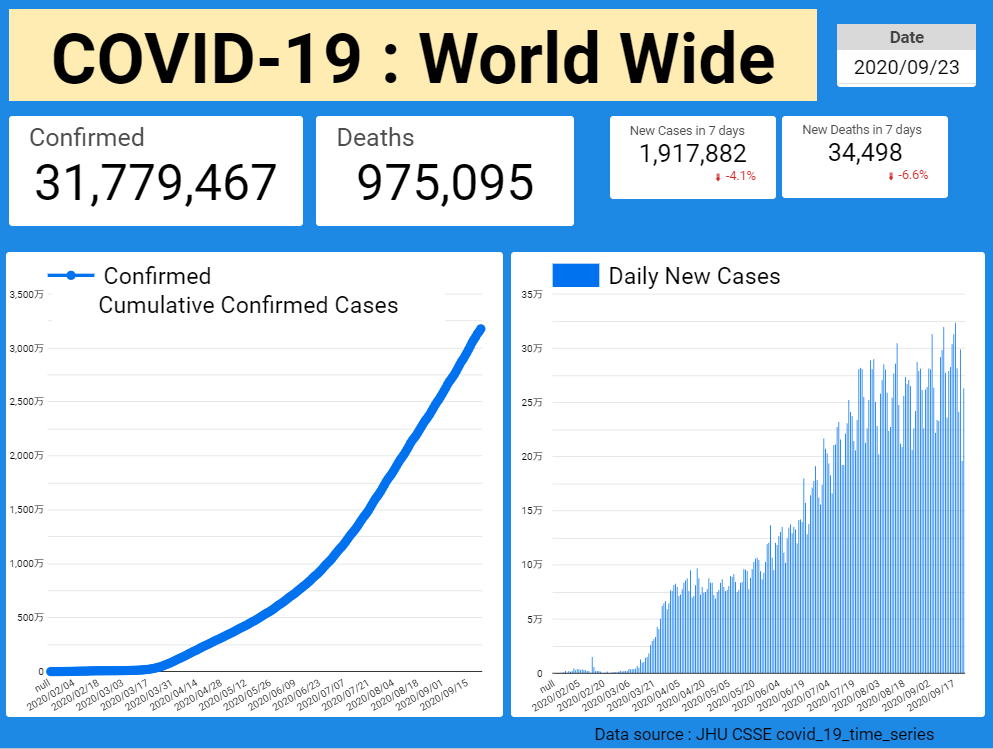
◆【データポータル】最新のデータをスコアカードに表示させるためのR言語によるデータ前処理
ジョンズ・ホプキンス大学やECDCのデータを利用して、新型コロナウイルスの感染確認者数や死亡者数のデータを可視化しています。グーグルのデータポータルで、グーグルスプレッドシートのデータを読み込んでレポートを作成しています。非常に簡単そうに思えるのに、実はできないのが、データポータルのスコアカードに最新の日付の感染確認者数や死亡者数の累計を表示することです。↓感染確認者数と死亡者数の累計は、9月24日に更新した、最新のデータ(9月23日のデータ)を表示しています。各国の累計値を日付で絞り込み、合計したものが表示されています。1日に一度データを更新しているのですが、例えば9月24日にデータを更新すると、9月23日のデータが最新のものになっています。この場合、データポータルのスコアカードで、「今日マイナス1日」と指定すれば、9月24日のうちはいいのですが、日付が変わって9月25日になると、9月24日のデータが更新されるまでスコアカードに表示するデータがないことになってしまいます。随時データが自動更新されるデータソースでない場合、最新のデータが表示されるようにするには工夫が必要になります。「今日マイナス2日」という運用にしておけば、9月24日時点では9月22日のデータがスコアカードに表示され、9月25日には9月23日のデータが表示されるので、表示するデータがないという事態は防ぐことができます。このような形で運用している場合もありますが、単純な累計値は最新のデータを表示させたいと思っています。最新のデータをスコアカードに表示させることができれば、それに越したことはありません。「最新のデータ」の指定の仕方として、日付に順位を付ける方法が考えられます。これまで、グーグルのスプレッドシート上の関数で日付に順位を付けて、データポータルのフィルタで日付の順位が1位のものに絞り込むことによって、スコアカードに表示させるデータを最新のものにしていました。データ量が増えてきたせいで、グーグルのスプレッドシートでの関数の計算にも時間がかかるようになり、データポータルでもエラーが出るようになってきました。少しでもスプレッドシートの負担を軽くするために、下記のRのコードで日付の順位付けをRの前処理で行うようにしました。下記の2行で日付の順位の列「Drank」が作成されます。なお、df_ECDCは、ECDCから読み込んで前処理をしたデータです。df_ECDC$Drank <- rank(df_ECDC$Date1, ties.method = "min") df_ECDC$Drank <- max(df_ECDC$Drank)-df_ECDC$Drank+1あとは、データポータルに読み込んだデータに対して、スコアカードの設定で「Drank=1」というフィルターを追加しておくだけで、最新のデータをスコアカードに表示させることができます。なお、上記のコードは、最新の日付の順位が1になればいいというもので、それぞれの日付にわかりやすく順位付けをする場合は、下記のようなコードを用いることになりますが、ループ処理なので時間がかかってしまいます。for(i in 1:length(df_ECDC$Date1)){df_ECDC$Drank[i] <-which(unique(df_ECDC$Date1)==df_ECDC$Date1[i])}df_ECDC$Drank <- length(unique(df_ECDC$Drank))-df_ECDC$Drank+1-----------------------------------------------------------------------------------------------------------------------------------------------------------------楽天市場で「マスク」を検索する楽天市場で「ポビドンヨード」を検索する楽天市場で「イソジン うがい薬」を探す楽天市場で「うがい薬」を検索する楽天市場で「マウスウォッシュ・洗口液」を探す-----------------------------------------------------------------------楽天市場で「フコイダン」を探す-----------------------------------------------------------------------AQUOS sense3 lite+Rakuten UN-LIMITプランセット(事務手数料3300円込)【22000円相当のポイント還元】価格:31280円(税別、送料別)(2020/7/15時点)楽天で購入ついに、AQUOS sense3 liteも高額ポイントの対象になりました。マイナンバーカードの読み取りに対応している機種です。----------------------------------------------------------------------------------Galaxy A7+Rakuten UN-LIMITプランセット(事務手数料3300円込)【15000円相当のポイント還元】価格:22000円(税込、送料無料) (2020/5/31時点)楽天で購入↑楽天市場店で購入すればよかったと思います:アマゾン・プライム・ビデオはHD 1080Pで視聴できます:有機ELなので、黒がきれいです:ヘッドホンでのドルビーアトモスに対応しています。-------------------------------------------------------------------------↓楽天市場以外の有名ストアの利用でも楽天ポイントが貯まります。----------------------------------------------------------------------------------------------------------------------------------------------------------------------------------------------------------------【ダッシュボード「COVID-19 Transition Graphs」を試作】こちらは、ジョンズ・ホプキンス大学のデータを利用したダッシュボードです。中国本土以外の地域への感染が拡大しているため、国別、地域別の感染者数の推移を簡単に確認できるダッシュボードを試作しています。随時、ページを追加しています。グラフのデータは、右上部分の操作でダウンロードすることができます。アメリカの「地域別の変数」を前処理して、「州別」での推移をグラフ化できるようにしました。また、州コードのフィールドを作成してコロプレス地図も作成しています。楽天ブログでは「iframe」タグが使えないので、Bloggerのページから利用できるようにしています。無料で利用できる、グーグルの「データポータル」のダッシュボードです。データさえあれば、簡単に作成できます。「国」別、「地域」別に日ごとの感染者数の推移を見ることができます。↓ダッシュボードの試作です。下記リンクのページから利用できます。ジョンズ・ホプキンス大学の「JHU CSSE」の「Covid19 Daily Reports」のデータを利用しています。 EdgeブラウザやIEブラウザなど、Chromeブラウザ以外での利用の場合はうまく表示されないことがあるようです。↓上記のダッシュボードのデータの出所のサイトです。マップがメインのダッシュボードです-----------------------------------------------------------------------------------------↓日本のインフルエンザの「定点当たり報告数」をグラフ化できるダッシュボードを試作。都道府県別にグラフ化可能です。--------------------------------------------------------------------------★おすすめの記事 ◆How Windows Sonic looks like.:Windows Sonic for Headphonesの音声と2chステレオ音声の比較:7.1.2chテストトーンの比較で明らかになった違い:一目で違いがわかりました----------------------------------------------------------------------------------------------------------
2020.09.25
コメント(0)
-
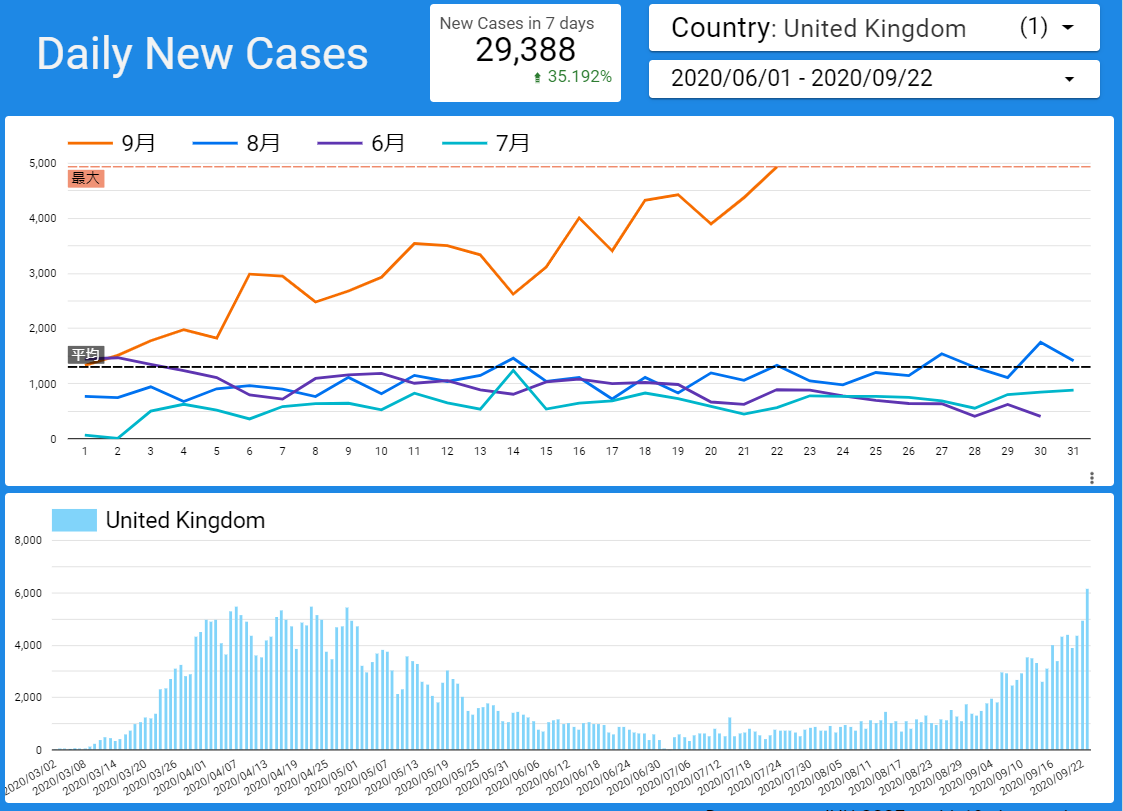
◆【新型コロナ】英国で感染確認者数の増加が続いています:9月になって急増:1日あたりで過去最高に:実効再生産数は1.28
イギリスの感染確認者数は、9月になって、急増しています。社会経済活動の活発化、気候などの影響によるものでしょうか。増え始めると、急速に増加していて、感染拡大の抑制は簡単ではないようです。実効再生産数も1.28となっていて、感染拡大局面にあるようです。↓ジョンズ・ホプキンス大学のデータを利用したダッシュボードです。データ量が増えて、グーグルスプレッドシートからの更新データの読み込み時にエラーが生じることが増えてきています。折れ線グラフを変更し、まだデータの無い日の折れ線が描画されないようにしました。↓フランスも8月下旬から増加しています。今週、1日あたりで過去最高の感染確認者数の数字が確認されています。なお、フランスでは土日には検査結果が公表されていないようです。-----------------------------------------------------------------------------------------------------------------------------------------------------------------楽天市場で「マスク」を検索する楽天市場で「ポビドンヨード」を検索する楽天市場で「イソジン うがい薬」を探す楽天市場で「うがい薬」を検索する楽天市場で「マウスウォッシュ・洗口液」を探す-----------------------------------------------------------------------楽天市場で「フコイダン」を探す-----------------------------------------------------------------------AQUOS sense3 lite+Rakuten UN-LIMITプランセット(事務手数料3300円込)【22000円相当のポイント還元】価格:31280円(税別、送料別)(2020/7/15時点)楽天で購入ついに、AQUOS sense3 liteも高額ポイントの対象になりました。マイナンバーカードの読み取りに対応している機種です。----------------------------------------------------------------------------------Galaxy A7+Rakuten UN-LIMITプランセット(事務手数料3300円込)【15000円相当のポイント還元】価格:22000円(税込、送料無料) (2020/5/31時点)楽天で購入↑楽天市場店で購入すればよかったと思います:アマゾン・プライム・ビデオはHD 1080Pで視聴できます:有機ELなので、黒がきれいです:ヘッドホンでのドルビーアトモスに対応しています。-------------------------------------------------------------------------↓楽天市場以外の有名ストアの利用でも楽天ポイントが貯まります。----------------------------------------------------------------------------------------------------------------------------------------------------------------------------------------------------------------【ダッシュボード「COVID-19 Transition Graphs」を試作】こちらは、ジョンズ・ホプキンス大学のデータを利用したダッシュボードです。中国本土以外の地域への感染が拡大しているため、国別、地域別の感染者数の推移を簡単に確認できるダッシュボードを試作しています。随時、ページを追加しています。グラフのデータは、右上部分の操作でダウンロードすることができます。アメリカの「地域別の変数」を前処理して、「州別」での推移をグラフ化できるようにしました。また、州コードのフィールドを作成してコロプレス地図も作成しています。楽天ブログでは「iframe」タグが使えないので、Bloggerのページから利用できるようにしています。無料で利用できる、グーグルの「データポータル」のダッシュボードです。データさえあれば、簡単に作成できます。「国」別、「地域」別に日ごとの感染者数の推移を見ることができます。↓ダッシュボードの試作です。下記リンクのページから利用できます。ジョンズ・ホプキンス大学の「JHU CSSE」の「Covid19 Daily Reports」のデータを利用しています。 EdgeブラウザやIEブラウザなど、Chromeブラウザ以外での利用の場合はうまく表示されないことがあるようです。↓上記のダッシュボードのデータの出所のサイトです。マップがメインのダッシュボードです-----------------------------------------------------------------------------------------↓日本のインフルエンザの「定点当たり報告数」をグラフ化できるダッシュボードを試作。都道府県別にグラフ化可能です。--------------------------------------------------------------------------★おすすめの記事 ◆How Windows Sonic looks like.:Windows Sonic for Headphonesの音声と2chステレオ音声の比較:7.1.2chテストトーンの比較で明らかになった違い:一目で違いがわかりました----------------------------------------------------------------------------------------------------------
2020.09.24
コメント(0)
-
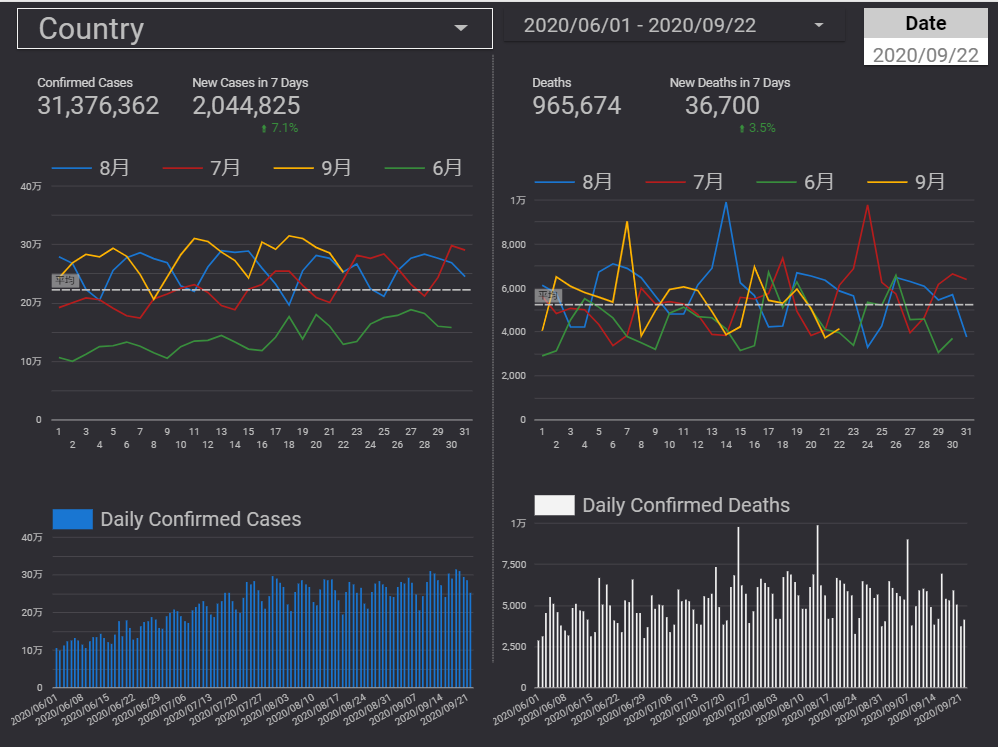
◆【新型コロナ】ダッシュボードに情報一覧性の高いページを追加しました:グーグルのデータポータルを利用しています
ECDCのデータを利用して、新型コロナウイルスの感染確認者数や死亡者数のデータをグラフ化しています。グーグルのデータポータルを利用したダッシュボードによるデータの可視化です。データポータルの機能を活用して、主要な情報をまとめたページを作成してみました。スコアカードでは、累積数のほか、直近7日間の新規感染確認者数、新規死亡者数のデータを表示するようにしました。過去の7日間と比べた増減率も表示しています。また、データの増減の動向を月単位で比較できる折れ線グラフは、わかりやすいのではないかと思います。グラフ中の平均の参照線は新しい機能で、グラフに表示されているデータの平均値が表示されるようになっています。デフォルトでは、世界全体の数字、グラフが表示されていますが、プルダウンメニューで、約200カ国からデータを表示させる国を選ぶことができます。また、グラフについては、表示するデータ期間の選択も可能になっています。スコアカードは、カスタムの比較期間を設定しているので、期間選択コントロールでは変更できないようです。基本的な情報を一覧できるので、ダッシュボードは便利だと思います。-----------------------------------------------------------------------------------------------------------------------------------------------------------------楽天市場で「マスク」を検索する楽天市場で「ポビドンヨード」を検索する楽天市場で「イソジン うがい薬」を探す楽天市場で「うがい薬」を検索する楽天市場で「マウスウォッシュ・洗口液」を探す-----------------------------------------------------------------------楽天市場で「フコイダン」を探す-----------------------------------------------------------------------AQUOS sense3 lite+Rakuten UN-LIMITプランセット(事務手数料3300円込)【22000円相当のポイント還元】価格:31280円(税別、送料別)(2020/7/15時点)楽天で購入ついに、AQUOS sense3 liteも高額ポイントの対象になりました。マイナンバーカードの読み取りに対応している機種です。----------------------------------------------------------------------------------Galaxy A7+Rakuten UN-LIMITプランセット(事務手数料3300円込)【15000円相当のポイント還元】価格:22000円(税込、送料無料) (2020/5/31時点)楽天で購入↑楽天市場店で購入すればよかったと思います:アマゾン・プライム・ビデオはHD 1080Pで視聴できます:有機ELなので、黒がきれいです:ヘッドホンでのドルビーアトモスに対応しています。-------------------------------------------------------------------------↓楽天市場以外の有名ストアの利用でも楽天ポイントが貯まります。----------------------------------------------------------------------------------------------------------------------------------------------------------------------------------------------------------------【ダッシュボード「COVID-19 Transition Graphs」を試作】こちらは、ジョンズ・ホプキンス大学のデータを利用したダッシュボードです。中国本土以外の地域への感染が拡大しているため、国別、地域別の感染者数の推移を簡単に確認できるダッシュボードを試作しています。随時、ページを追加しています。グラフのデータは、右上部分の操作でダウンロードすることができます。アメリカの「地域別の変数」を前処理して、「州別」での推移をグラフ化できるようにしました。また、州コードのフィールドを作成してコロプレス地図も作成しています。楽天ブログでは「iframe」タグが使えないので、Bloggerのページから利用できるようにしています。無料で利用できる、グーグルの「データポータル」のダッシュボードです。データさえあれば、簡単に作成できます。「国」別、「地域」別に日ごとの感染者数の推移を見ることができます。↓ダッシュボードの試作です。下記リンクのページから利用できます。ジョンズ・ホプキンス大学の「JHU CSSE」の「Covid19 Daily Reports」のデータを利用しています。 EdgeブラウザやIEブラウザなど、Chromeブラウザ以外での利用の場合はうまく表示されないことがあるようです。↓上記のダッシュボードのデータの出所のサイトです。マップがメインのダッシュボードです-----------------------------------------------------------------------------------------↓日本のインフルエンザの「定点当たり報告数」をグラフ化できるダッシュボードを試作。都道府県別にグラフ化可能です。--------------------------------------------------------------------------★おすすめの記事 ◆How Windows Sonic looks like.:Windows Sonic for Headphonesの音声と2chステレオ音声の比較:7.1.2chテストトーンの比較で明らかになった違い:一目で違いがわかりました----------------------------------------------------------------------------------------------------------
2020.09.23
コメント(0)
-
◆【新型コロナ】アビガンが臨床試験で主要評価項目を達成:10月中に承認申請:やっと承認されるのでしょうか?
アビガンが臨床試験で、主要評価項目を達成したそうです。富士フイルム富山化学が、10月中に承認申請をするそうです。ようやく、新型コロナウイルス感染症適応の承認薬になるのでしょうか。それにしても、スピード感がないと思います。-----------------------------------------------------------------------------------------------------------------------------------------------------------------楽天市場で「マスク」を検索する楽天市場で「ポビドンヨード」を検索する楽天市場で「イソジン うがい薬」を探す楽天市場で「うがい薬」を検索する楽天市場で「マウスウォッシュ・洗口液」を探す-----------------------------------------------------------------------楽天市場で「フコイダン」を探す-----------------------------------------------------------------------AQUOS sense3 lite+Rakuten UN-LIMITプランセット(事務手数料3300円込)【22000円相当のポイント還元】価格:31280円(税別、送料別)(2020/7/15時点)楽天で購入ついに、AQUOS sense3 liteも高額ポイントの対象になりました。マイナンバーカードの読み取りに対応している機種です。----------------------------------------------------------------------------------Galaxy A7+Rakuten UN-LIMITプランセット(事務手数料3300円込)【15000円相当のポイント還元】価格:22000円(税込、送料無料) (2020/5/31時点)楽天で購入↑楽天市場店で購入すればよかったと思います:アマゾン・プライム・ビデオはHD 1080Pで視聴できます:有機ELなので、黒がきれいです:ヘッドホンでのドルビーアトモスに対応しています。-------------------------------------------------------------------------↓楽天市場以外の有名ストアの利用でも楽天ポイントが貯まります。----------------------------------------------------------------------------------------------------------------------------------------------------------------------------------------------------------------【ダッシュボード「COVID-19 Transition Graphs」を試作】こちらは、ジョンズ・ホプキンス大学のデータを利用したダッシュボードです。中国本土以外の地域への感染が拡大しているため、国別、地域別の感染者数の推移を簡単に確認できるダッシュボードを試作しています。随時、ページを追加しています。グラフのデータは、右上部分の操作でダウンロードすることができます。アメリカの「地域別の変数」を前処理して、「州別」での推移をグラフ化できるようにしました。また、州コードのフィールドを作成してコロプレス地図も作成しています。楽天ブログでは「iframe」タグが使えないので、Bloggerのページから利用できるようにしています。無料で利用できる、グーグルの「データポータル」のダッシュボードです。データさえあれば、簡単に作成できます。「国」別、「地域」別に日ごとの感染者数の推移を見ることができます。↓ダッシュボードの試作です。下記リンクのページから利用できます。ジョンズ・ホプキンス大学の「JHU CSSE」の「Covid19 Daily Reports」のデータを利用しています。 EdgeブラウザやIEブラウザなど、Chromeブラウザ以外での利用の場合はうまく表示されないことがあるようです。↓上記のダッシュボードのデータの出所のサイトです。マップがメインのダッシュボードです-----------------------------------------------------------------------------------------↓日本のインフルエンザの「定点当たり報告数」をグラフ化できるダッシュボードを試作。都道府県別にグラフ化可能です。--------------------------------------------------------------------------★おすすめの記事 ◆How Windows Sonic looks like.:Windows Sonic for Headphonesの音声と2chステレオ音声の比較:7.1.2chテストトーンの比較で明らかになった違い:一目で違いがわかりました----------------------------------------------------------------------------------------------------------
2020.09.23
コメント(0)
-
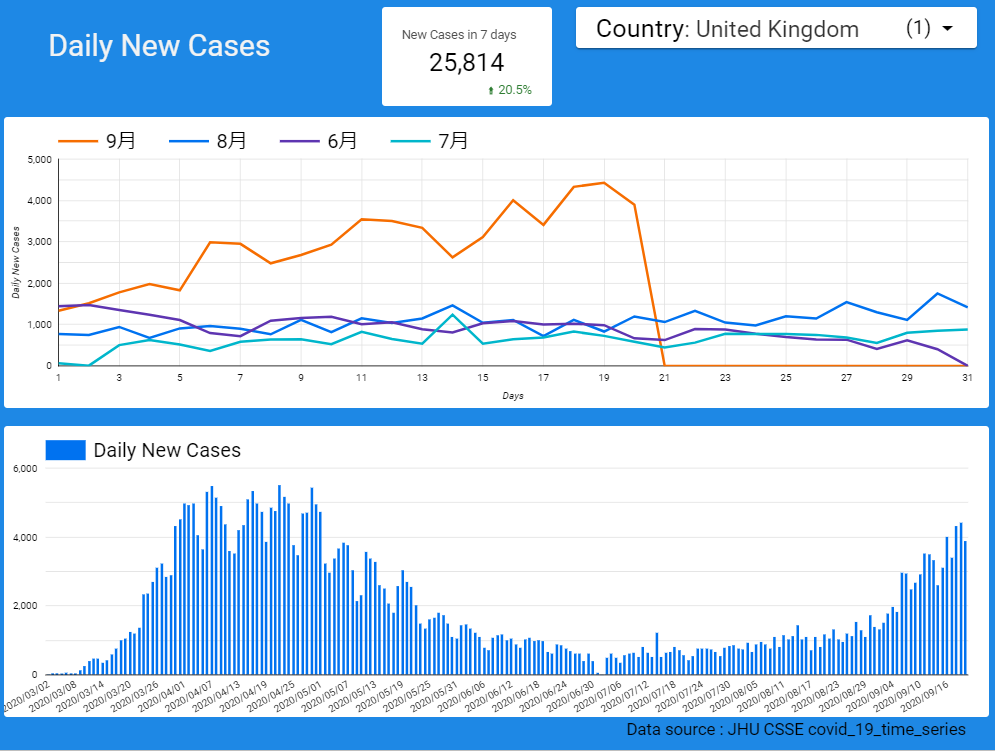
◆【新型コロナ】英国で感染確認者数が増加中です:第1波の時と同じような水準になってきています:月単位で比較できるグラフを作ってみました
欧州の株価が急落しましたが、新型コロナの感染拡大懸念もその理由の一つとされているようです。イギリスでは、「再びロックダウンが必要になるかもしれない」ということが言われるほど、感染確認者数の増加が進行中です。確かに、毎日の新規感染確認者数は、第1波と同じような規模になってきています。日別の感染確認者数を月単位で比較して見ることができるグラフを作成してみました。いかにもダッシュボードらしいグラフですが、月単位での動向がわかりやすいのではないかと思います。英国では、9月の上旬以降の新規感染確認者数は、8月、7月、6月の水準を上回っています。↓感染確認者数の増減傾向について、よりわかりやすいページをダッシュボードに追加してみました。プルダウンで、表示させる国を選ぶことができます。スコアタイルでは1週間の新規感染確認者数と、前週と比較した増減率を表示しています。上の段のグラフは、日ごとの月別比較のグラフです。過去の月と比べて、今月は多いのか少ないのかがわかりやすいと思います。-----------------------------------------------------------------------------------------------------------------------------------------------------------------楽天市場で「マスク」を検索する楽天市場で「ポビドンヨード」を検索する楽天市場で「イソジン うがい薬」を探す楽天市場で「うがい薬」を検索する楽天市場で「マウスウォッシュ・洗口液」を探す-----------------------------------------------------------------------楽天市場で「フコイダン」を探す-----------------------------------------------------------------------AQUOS sense3 lite+Rakuten UN-LIMITプランセット(事務手数料3300円込)【22000円相当のポイント還元】価格:31280円(税別、送料別)(2020/7/15時点)楽天で購入ついに、AQUOS sense3 liteも高額ポイントの対象になりました。マイナンバーカードの読み取りに対応している機種です。----------------------------------------------------------------------------------Galaxy A7+Rakuten UN-LIMITプランセット(事務手数料3300円込)【15000円相当のポイント還元】価格:22000円(税込、送料無料) (2020/5/31時点)楽天で購入↑楽天市場店で購入すればよかったと思います:アマゾン・プライム・ビデオはHD 1080Pで視聴できます:有機ELなので、黒がきれいです:ヘッドホンでのドルビーアトモスに対応しています。-------------------------------------------------------------------------↓楽天市場以外の有名ストアの利用でも楽天ポイントが貯まります。----------------------------------------------------------------------------------------------------------------------------------------------------------------------------------------------------------------【ダッシュボード「COVID-19 Transition Graphs」を試作】こちらは、ジョンズ・ホプキンス大学のデータを利用したダッシュボードです。中国本土以外の地域への感染が拡大しているため、国別、地域別の感染者数の推移を簡単に確認できるダッシュボードを試作しています。随時、ページを追加しています。グラフのデータは、右上部分の操作でダウンロードすることができます。アメリカの「地域別の変数」を前処理して、「州別」での推移をグラフ化できるようにしました。また、州コードのフィールドを作成してコロプレス地図も作成しています。楽天ブログでは「iframe」タグが使えないので、Bloggerのページから利用できるようにしています。無料で利用できる、グーグルの「データポータル」のダッシュボードです。データさえあれば、簡単に作成できます。「国」別、「地域」別に日ごとの感染者数の推移を見ることができます。↓ダッシュボードの試作です。下記リンクのページから利用できます。ジョンズ・ホプキンス大学の「JHU CSSE」の「Covid19 Daily Reports」のデータを利用しています。 EdgeブラウザやIEブラウザなど、Chromeブラウザ以外での利用の場合はうまく表示されないことがあるようです。↓上記のダッシュボードのデータの出所のサイトです。マップがメインのダッシュボードです-----------------------------------------------------------------------------------------↓日本のインフルエンザの「定点当たり報告数」をグラフ化できるダッシュボードを試作。都道府県別にグラフ化可能です。--------------------------------------------------------------------------★おすすめの記事 ◆How Windows Sonic looks like.:Windows Sonic for Headphonesの音声と2chステレオ音声の比較:7.1.2chテストトーンの比較で明らかになった違い:一目で違いがわかりました----------------------------------------------------------------------------------------------------------
2020.09.22
コメント(0)
-
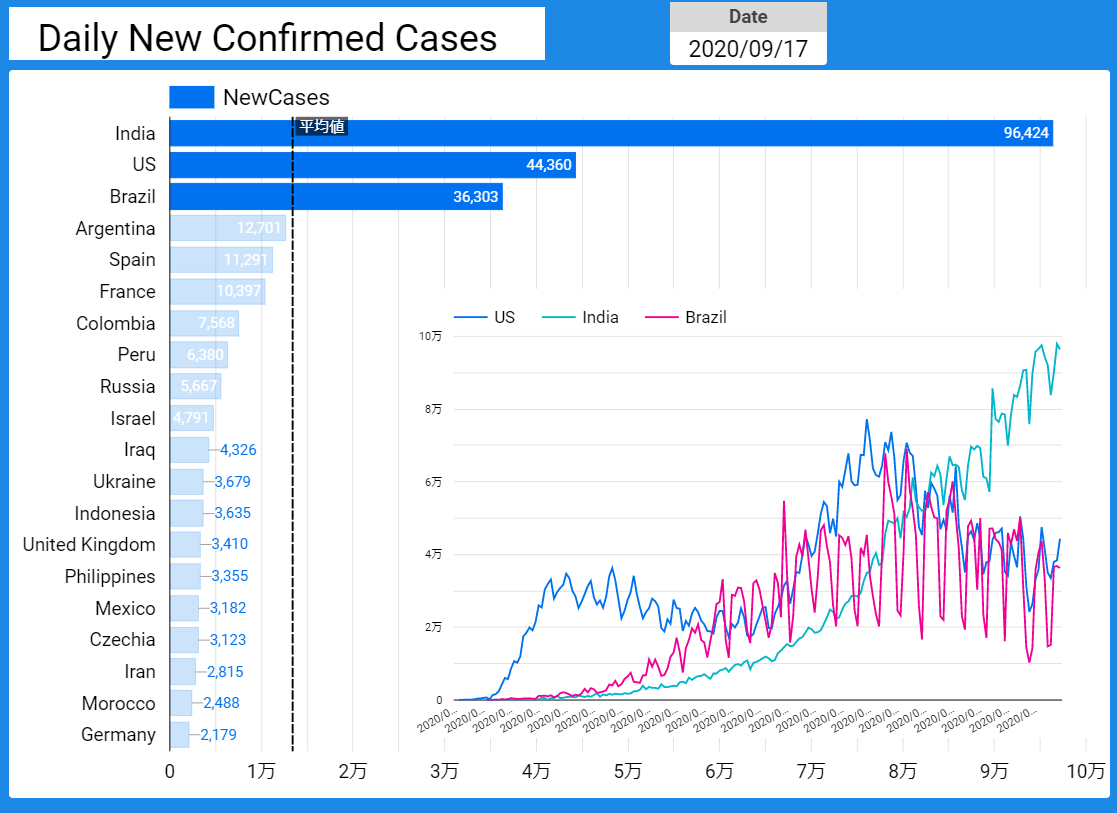
◆【新型コロナ】かなりデータが重たくなってきました:感染確認者数、死亡者数のダッシュボード:インドで感染拡大が大変なことになってきているようです
ジョンズ・ホプキンス大学のデータを利用して作成しているダッシュボードですが、動作が重たくなってきているようです。↓現在、日々の新規感染確認者数はインドが最多で、その数はどんどん、増えています。棒グラフを選択すると、右下の折れ線グラフに表示される国が選択される仕組みです。インドの毎日の感染確認者数は右肩上がりで増加中です。ダッシュボード用のデータですが、Github.comのページから、csv形式のデータをRに読み込んで前処理をし、倍加時間や実効再生産数などを計算したものをグーグルスプレッドシートに読み込み、データポータルのダッシュボードでそのスプレッドシートのデータを参照しています。ふと気づくと、ダッシュボードのページにロシアのデータが表示されなくなっていました。他の国でも表示されない場合があったようです。グーグルスプレッドシートで、ロシアのデータが欠けていました。R言語でジョンズ・ホプキンス大学のデータの前処理をしているのですが、何らかの理由で突然エラーを起こすようになったようです。とりあえず、エラーの出所はわかりました。2~3日前までは、ロシアのデータは処理されていたので、データ側の問題なのか、R言語の処理のエラーなのかよくわかりません。どうやら、感染確認者数と死亡者数と回復者数のデータを一体化する「dplyr::left_join」コマンドで、結合キーを「by = c("Province.State","Country","Date", "Lat", "Long_")」としていたのがよくなかったようで、結合によって、ある列がすべて「NA」になるというエラーのでる国がありました。そこで、結合キーを「by = c("Province.State","Country","Date")」と、必要最小限にしたところ、今のところうまくいっているようです。9月17日時点で、データの行数は、3万行弱になってきていて、グーグルスプレッドシートに読み込むのにも時間がかかるようになってきています。データポータルのページの反応も重たくなってきています。今の仕組みだと、3万行くらいのデータがそろそろ限界なのかもしれません。↓日々の死亡者数もインドが最多になっています。世界の1日あたりの死亡者数の国別の平均値は約200人のようですが、最近の日本の20倍以上になります。データポータルのグラフで「基準線(平均値)」の追加が簡単にできるようになっていて、手軽に平均値がわかるようになりました。-----------------------------------------------------------------------------------------------------------------------------------------------------------------楽天市場で「マスク」を検索する楽天市場で「ポビドンヨード」を検索する楽天市場で「イソジン うがい薬」を探す楽天市場で「うがい薬」を検索する楽天市場で「マウスウォッシュ・洗口液」を探す-----------------------------------------------------------------------楽天市場で「フコイダン」を探す-----------------------------------------------------------------------AQUOS sense3 lite+Rakuten UN-LIMITプランセット(事務手数料3300円込)【22000円相当のポイント還元】価格:31280円(税別、送料別)(2020/7/15時点)楽天で購入ついに、AQUOS sense3 liteも高額ポイントの対象になりました。マイナンバーカードの読み取りに対応している機種です。----------------------------------------------------------------------------------Galaxy A7+Rakuten UN-LIMITプランセット(事務手数料3300円込)【15000円相当のポイント還元】価格:22000円(税込、送料無料) (2020/5/31時点)楽天で購入↑楽天市場店で購入すればよかったと思います:アマゾン・プライム・ビデオはHD 1080Pで視聴できます:有機ELなので、黒がきれいです:ヘッドホンでのドルビーアトモスに対応しています。-------------------------------------------------------------------------↓楽天市場以外の有名ストアの利用でも楽天ポイントが貯まります。----------------------------------------------------------------------------------------------------------------------------------------------------------------------------------------------------------------【ダッシュボード「COVID-19 Transition Graphs」を試作】こちらは、ジョンズ・ホプキンス大学のデータを利用したダッシュボードです。中国本土以外の地域への感染が拡大しているため、国別、地域別の感染者数の推移を簡単に確認できるダッシュボードを試作しています。随時、ページを追加しています。グラフのデータは、右上部分の操作でダウンロードすることができます。アメリカの「地域別の変数」を前処理して、「州別」での推移をグラフ化できるようにしました。また、州コードのフィールドを作成してコロプレス地図も作成しています。楽天ブログでは「iframe」タグが使えないので、Bloggerのページから利用できるようにしています。無料で利用できる、グーグルの「データポータル」のダッシュボードです。データさえあれば、簡単に作成できます。「国」別、「地域」別に日ごとの感染者数の推移を見ることができます。↓ダッシュボードの試作です。下記リンクのページから利用できます。ジョンズ・ホプキンス大学の「JHU CSSE」の「Covid19 Daily Reports」のデータを利用しています。 EdgeブラウザやIEブラウザなど、Chromeブラウザ以外での利用の場合はうまく表示されないことがあるようです。↓上記のダッシュボードのデータの出所のサイトです。マップがメインのダッシュボードです-----------------------------------------------------------------------------------------↓日本のインフルエンザの「定点当たり報告数」をグラフ化できるダッシュボードを試作。都道府県別にグラフ化可能です。--------------------------------------------------------------------------★おすすめの記事 ◆How Windows Sonic looks like.:Windows Sonic for Headphonesの音声と2chステレオ音声の比較:7.1.2chテストトーンの比較で明らかになった違い:一目で違いがわかりました----------------------------------------------------------------------------------------------------------
2020.09.19
コメント(0)
-
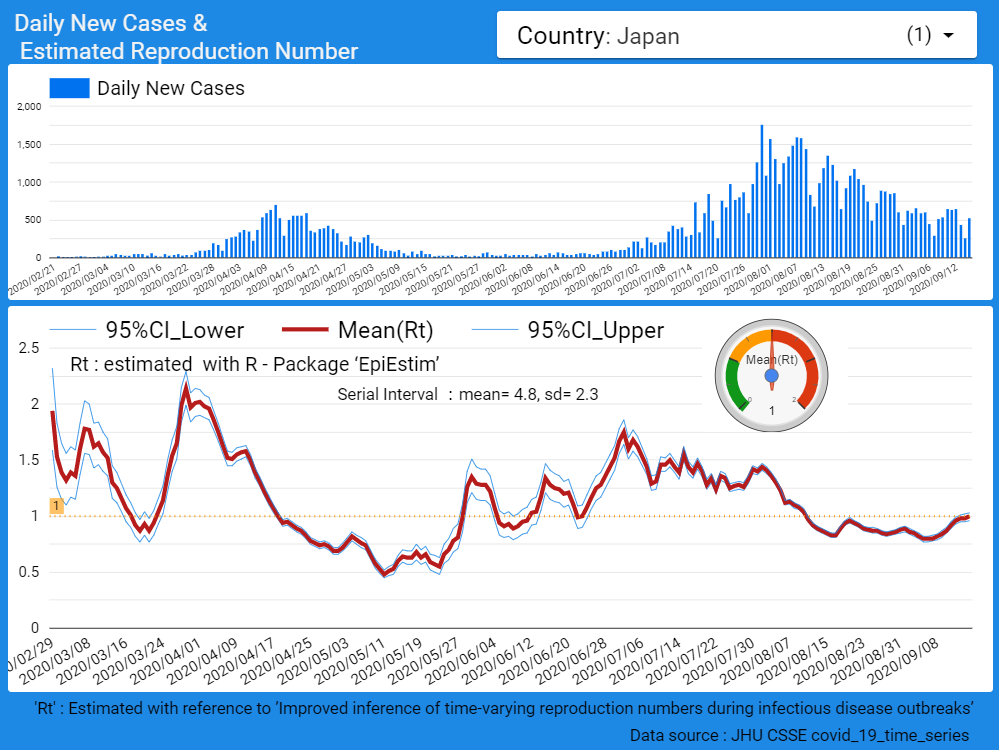
◆【新型コロナ】日本の実効再生産数は「1」:当面は感染確認者数は横ばいで推移しそうです
日本の実効再生産数はちょうど「1」です。当面の間は、感染確認者数は横ばいで推移するのではないでしょうか。↓ジョンズ・ホプキンス大学のデータを利用したダッシュボードです国内の日々の死亡者数は減少に転じたようです。10日間の死亡者数の累計は、140人をピークに、現在、102人の水準になってきています。第1波の時よりもピークは低かったようです。↓ECDCのデータを利用したダッシュボードです-----------------------------------------------------------------------------------------------------------------------------------------------------------------楽天市場で「マスク」を検索する楽天市場で「ポビドンヨード」を検索する楽天市場で「イソジン うがい薬」を探す楽天市場で「うがい薬」を検索する楽天市場で「マウスウォッシュ・洗口液」を探す-----------------------------------------------------------------------楽天市場で「フコイダン」を探す-----------------------------------------------------------------------AQUOS sense3 lite+Rakuten UN-LIMITプランセット(事務手数料3300円込)【22000円相当のポイント還元】価格:31280円(税別、送料別)(2020/7/15時点)楽天で購入ついに、AQUOS sense3 liteも高額ポイントの対象になりました。マイナンバーカードの読み取りに対応している機種です。----------------------------------------------------------------------------------Galaxy A7+Rakuten UN-LIMITプランセット(事務手数料3300円込)【15000円相当のポイント還元】価格:22000円(税込、送料無料) (2020/5/31時点)楽天で購入↑楽天市場店で購入すればよかったと思います:アマゾン・プライム・ビデオはHD 1080Pで視聴できます:有機ELなので、黒がきれいです:ヘッドホンでのドルビーアトモスに対応しています。-------------------------------------------------------------------------↓楽天市場以外の有名ストアの利用でも楽天ポイントが貯まります。----------------------------------------------------------------------------------------------------------------------------------------------------------------------------------------------------------------【ダッシュボード「COVID-19 Transition Graphs」を試作】こちらは、ジョンズ・ホプキンス大学のデータを利用したダッシュボードです。中国本土以外の地域への感染が拡大しているため、国別、地域別の感染者数の推移を簡単に確認できるダッシュボードを試作しています。随時、ページを追加しています。グラフのデータは、右上部分の操作でダウンロードすることができます。アメリカの「地域別の変数」を前処理して、「州別」での推移をグラフ化できるようにしました。また、州コードのフィールドを作成してコロプレス地図も作成しています。楽天ブログでは「iframe」タグが使えないので、Bloggerのページから利用できるようにしています。無料で利用できる、グーグルの「データポータル」のダッシュボードです。データさえあれば、簡単に作成できます。「国」別、「地域」別に日ごとの感染者数の推移を見ることができます。↓ダッシュボードの試作です。下記リンクのページから利用できます。ジョンズ・ホプキンス大学の「JHU CSSE」の「Covid19 Daily Reports」のデータを利用しています。 EdgeブラウザやIEブラウザなど、Chromeブラウザ以外での利用の場合はうまく表示されないことがあるようです。↓上記のダッシュボードのデータの出所のサイトです。マップがメインのダッシュボードです-----------------------------------------------------------------------------------------↓日本のインフルエンザの「定点当たり報告数」をグラフ化できるダッシュボードを試作。都道府県別にグラフ化可能です。--------------------------------------------------------------------------★おすすめの記事 ◆How Windows Sonic looks like.:Windows Sonic for Headphonesの音声と2chステレオ音声の比較:7.1.2chテストトーンの比較で明らかになった違い:一目で違いがわかりました----------------------------------------------------------------------------------------------------------
2020.09.16
コメント(0)
-
◆【体温記録アプリ】体温の数値を「スライダー」で入力する方法:体温の数字の入力が簡単になりました
先日のブログで、マイクロソフトのPower Appsで体温記録アプリを作成してみましたが、スマホではできるだけテキスト入力をしたくありません。プルダウンだとリストが長くて入力しづらそうなので、スライダーでの入力を試してみました。Power Appsでは、スライダーコントロール※で数字を入力することができますが、数字の増減単位は「1」のようです。ということは、スライダーを動かすと、1ずつ増減することになります。36.5℃のように「0.1」ずつ指定したい場合には工夫が必要なようです。※スライダーコントロールは、「ハンドルをドラッグすることによりユーザーが値を指定できるコントロール」です。ユーザーは、選択した方向に基づいて、スライダーのハンドルを左右にドラッグして、指定した最小値と最大値の間の値を指定できます。上の図のPower Appsのアプリのデータ入力画面のページを編集します。手順1)「挿入」タブで、「スライダー」を選んで、スライダーコントロールを画面に挿入します。スライダーコントロールを体温を入力するテキスト入力欄の下に配置します。スライダーの詳細設定Maxの欄に 400 と入力(最大値を40℃にする場合)Minの欄に 350 と入力(最小値を35℃にする場合)Defaultの欄に 361 と入力 → 下記のテキスト入力欄には、36.1と入力されますあるいは、Defaultの欄に Value(dataValue*10) と入力すると、テキスト入力欄の数字がスライダーに反映されます手順2)体温を入力するテキスト入力欄の詳細設定でDefaultの欄に Value(Slider1.Value/10) と入力OnChangeの欄に UpdateContext({dataValue: Value(DataCardValue7.Text)}) と入力以上の設定で、スライダーで0.1℃単位の体温をテキスト入力欄に入力できます。要するに、スライダーの数字の10分の1の値をテキスト入力欄に入力する、というだけのことです。ただし、スライダーハンドルを操作した時のスライダーでの表示は360とか362とかの3桁の数字になっています。この表示を変更できないかどうか調べていますが、今のところは解決策が見つかっていません。なお、「DataCardValue7」は当該テキスト入力欄の名前で、名前は変更できます。ハンドルを動かすときにスライダーの数字の表示を消すことはできますが、それだと入力しづらくなってしまいます。まあ、テキスト入力よりは格段に楽になるので、スライダー入力は便利だと思います。-----------------------------------------------------------------------------------------------------------------------------------------------------------------楽天市場で「マスク」を検索する楽天市場で「ポビドンヨード」を検索する楽天市場で「イソジン うがい薬」を探す楽天市場で「うがい薬」を検索する楽天市場で「マウスウォッシュ・洗口液」を探す-----------------------------------------------------------------------楽天市場で「フコイダン」を探す-----------------------------------------------------------------------↓うがいがそれなりに注目されているようですが、臨床研究はまだこれからのようです。↓口腔衛生に注目し、うがいの効果についてまとめられている論文です。日本の水道水によるうがいも効果がないわけではないようです。昔のカルキ臭の強い水道水の方が効果があるのでしょうか。そういえば、冷蔵庫の製氷機にはミネラルウォーターではなく、水道水を用いることが求められています。AQUOS sense3 lite+Rakuten UN-LIMITプランセット(事務手数料3300円込)【22000円相当のポイント還元】価格:31280円(税別、送料別)(2020/7/15時点)楽天で購入ついに、AQUOS sense3 liteも高額ポイントの対象になりました。マイナンバーカードの読み取りに対応している機種です。----------------------------------------------------------------------------------Galaxy A7+Rakuten UN-LIMITプランセット(事務手数料3300円込)【15000円相当のポイント還元】価格:22000円(税込、送料無料) (2020/5/31時点)楽天で購入↑楽天市場店で購入すればよかったと思います:アマゾン・プライム・ビデオはHD 1080Pで視聴できます:有機ELなので、黒がきれいです:ヘッドホンでのドルビーアトモスに対応しています。-------------------------------------------------------------------------↓楽天市場以外の有名ストアの利用でも楽天ポイントが貯まります。----------------------------------------------------------------------------------------------------------------------------------------------------------------------------------------------------------------【ダッシュボード「COVID-19 Transition Graphs」を試作】こちらは、ジョンズ・ホプキンス大学のデータを利用したダッシュボードです。中国本土以外の地域への感染が拡大しているため、国別、地域別の感染者数の推移を簡単に確認できるダッシュボードを試作しています。随時、ページを追加しています。グラフのデータは、右上部分の操作でダウンロードすることができます。アメリカの「地域別の変数」を前処理して、「州別」での推移をグラフ化できるようにしました。また、州コードのフィールドを作成してコロプレス地図も作成しています。楽天ブログでは「iframe」タグが使えないので、Bloggerのページから利用できるようにしています。無料で利用できる、グーグルの「データポータル」のダッシュボードです。データさえあれば、簡単に作成できます。「国」別、「地域」別に日ごとの感染者数の推移を見ることができます。↓ダッシュボードの試作です。下記リンクのページから利用できます。ジョンズ・ホプキンス大学の「JHU CSSE」の「Covid19 Daily Reports」のデータを利用しています。 EdgeブラウザやIEブラウザなど、Chromeブラウザ以外での利用の場合はうまく表示されないことがあるようです。↓上記のダッシュボードのデータの出所のサイトです。マップがメインのダッシュボードです-----------------------------------------------------------------------------------------↓日本のインフルエンザの「定点当たり報告数」をグラフ化できるダッシュボードを試作。都道府県別にグラフ化可能です。--------------------------------------------------------------------------★おすすめの記事 ◆How Windows Sonic looks like.:Windows Sonic for Headphonesの音声と2chステレオ音声の比較:7.1.2chテストトーンの比較で明らかになった違い:一目で違いがわかりました----------------------------------------------------------------------------------------------------------
2020.09.15
コメント(0)
-
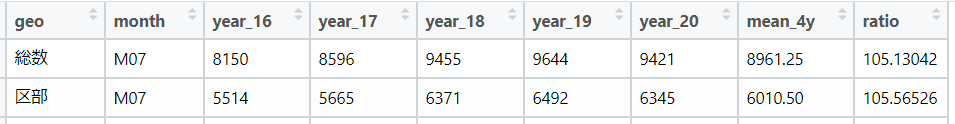
◆【新型コロナ】東京都の7月の死亡者数は、過去4年平均よりやや多くなっています:ただし、過去2年と同じ水準です
東京都の7月の死亡者数は、過去4年平均を100とすると、105.1という水準で、やや多くなっています。ただし、2018年、2019年とほぼ同じ数になっています。7月については、死亡者数が特に多いということはなさそうです。↓ダッシュボードで、市区町村別のグラフを利用できます。-----------------------------------------------------------------------------------------------------------------------------------------------------------------楽天市場で「マスク」を検索する楽天市場で「ポビドンヨード」を検索する楽天市場で「イソジン うがい薬」を探す楽天市場で「うがい薬」を検索する楽天市場で「マウスウォッシュ・洗口液」を探す-----------------------------------------------------------------------楽天市場で「フコイダン」を探す-----------------------------------------------------------------------↓うがいがそれなりに注目されているようですが、臨床研究はまだこれからのようです。↓口腔衛生に注目し、うがいの効果についてまとめられている論文です。日本の水道水によるうがいも効果がないわけではないようです。昔のカルキ臭の強い水道水の方が効果があるのでしょうか。そういえば、冷蔵庫の製氷機にはミネラルウォーターではなく、水道水を用いることが求められています。AQUOS sense3 lite+Rakuten UN-LIMITプランセット(事務手数料3300円込)【22000円相当のポイント還元】価格:31280円(税別、送料別)(2020/7/15時点)楽天で購入ついに、AQUOS sense3 liteも高額ポイントの対象になりました。マイナンバーカードの読み取りに対応している機種です。----------------------------------------------------------------------------------Galaxy A7+Rakuten UN-LIMITプランセット(事務手数料3300円込)【15000円相当のポイント還元】価格:22000円(税込、送料無料) (2020/5/31時点)楽天で購入↑楽天市場店で購入すればよかったと思います:アマゾン・プライム・ビデオはHD 1080Pで視聴できます:有機ELなので、黒がきれいです:ヘッドホンでのドルビーアトモスに対応しています。-------------------------------------------------------------------------↓楽天市場以外の有名ストアの利用でも楽天ポイントが貯まります。----------------------------------------------------------------------------------------------------------------------------------------------------------------------------------------------------------------【ダッシュボード「COVID-19 Transition Graphs」を試作】こちらは、ジョンズ・ホプキンス大学のデータを利用したダッシュボードです。中国本土以外の地域への感染が拡大しているため、国別、地域別の感染者数の推移を簡単に確認できるダッシュボードを試作しています。随時、ページを追加しています。グラフのデータは、右上部分の操作でダウンロードすることができます。アメリカの「地域別の変数」を前処理して、「州別」での推移をグラフ化できるようにしました。また、州コードのフィールドを作成してコロプレス地図も作成しています。楽天ブログでは「iframe」タグが使えないので、Bloggerのページから利用できるようにしています。無料で利用できる、グーグルの「データポータル」のダッシュボードです。データさえあれば、簡単に作成できます。「国」別、「地域」別に日ごとの感染者数の推移を見ることができます。↓ダッシュボードの試作です。下記リンクのページから利用できます。ジョンズ・ホプキンス大学の「JHU CSSE」の「Covid19 Daily Reports」のデータを利用しています。 EdgeブラウザやIEブラウザなど、Chromeブラウザ以外での利用の場合はうまく表示されないことがあるようです。↓上記のダッシュボードのデータの出所のサイトです。マップがメインのダッシュボードです-----------------------------------------------------------------------------------------↓日本のインフルエンザの「定点当たり報告数」をグラフ化できるダッシュボードを試作。都道府県別にグラフ化可能です。--------------------------------------------------------------------------★おすすめの記事 ◆How Windows Sonic looks like.:Windows Sonic for Headphonesの音声と2chステレオ音声の比較:7.1.2chテストトーンの比較で明らかになった違い:一目で違いがわかりました----------------------------------------------------------------------------------------------------------
2020.09.15
コメント(0)
-
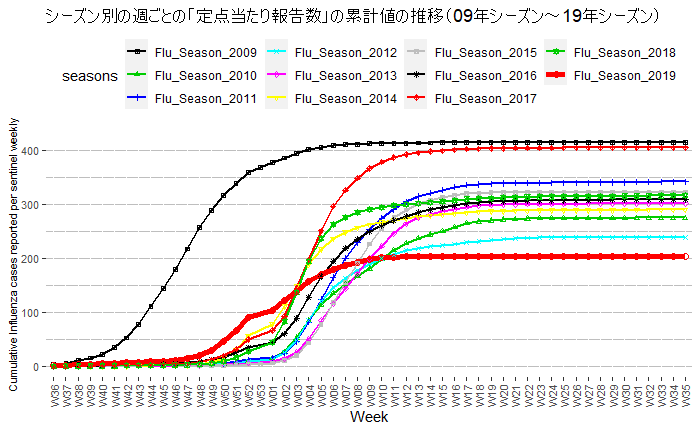
◆【インフルエンザ】2019年シーズンの定点当たり報告数の累計値は、過去11年で最低の水準でした
インフルエンザの2019年シーズン(19年第36週~20年第35週)の定点当たり報告数の累計値は、2009年シーズン以降で最低の水準でした。2019年シーズンで、インフルエンザの報告数が少なかったのは、新型コロナウイルスの予防対策によるものだと思われますが、医療機関の受診控えも影響した可能性があります。お医者さんや薬屋さんにとっては、減収要因です。2020年のインフルエンザシーズン(20年第36週~)が始まりましたが、このシーズンはどのような展開になるのでしょうか。今シーズンは、海外からの流入が、例年と比べて極端に少なくなるのは間違いなさそうです。-----------------------------------------------------------------------------------------------------------------------------------------------------------------楽天市場で「マスク」を検索する楽天市場で「ポビドンヨード」を検索する楽天市場で「イソジン うがい薬」を探す楽天市場で「うがい薬」を検索する楽天市場で「マウスウォッシュ・洗口液」を探す-----------------------------------------------------------------------楽天市場で「フコイダン」を探す-----------------------------------------------------------------------↓うがいがそれなりに注目されているようですが、臨床研究はまだこれからのようです。↓口腔衛生に注目し、うがいの効果についてまとめられている論文です。日本の水道水によるうがいも効果がないわけではないようです。昔のカルキ臭の強い水道水の方が効果があるのでしょうか。そういえば、冷蔵庫の製氷機にはミネラルウォーターではなく、水道水を用いることが求められています。AQUOS sense3 lite+Rakuten UN-LIMITプランセット(事務手数料3300円込)【22000円相当のポイント還元】価格:31280円(税別、送料別)(2020/7/15時点)楽天で購入ついに、AQUOS sense3 liteも高額ポイントの対象になりました。マイナンバーカードの読み取りに対応している機種です。----------------------------------------------------------------------------------Galaxy A7+Rakuten UN-LIMITプランセット(事務手数料3300円込)【15000円相当のポイント還元】価格:22000円(税込、送料無料) (2020/5/31時点)楽天で購入↑楽天市場店で購入すればよかったと思います:アマゾン・プライム・ビデオはHD 1080Pで視聴できます:有機ELなので、黒がきれいです:ヘッドホンでのドルビーアトモスに対応しています。-------------------------------------------------------------------------↓楽天市場以外の有名ストアの利用でも楽天ポイントが貯まります。----------------------------------------------------------------------------------------------------------------------------------------------------------------------------------------------------------------【ダッシュボード「COVID-19 Transition Graphs」を試作】こちらは、ジョンズ・ホプキンス大学のデータを利用したダッシュボードです。中国本土以外の地域への感染が拡大しているため、国別、地域別の感染者数の推移を簡単に確認できるダッシュボードを試作しています。随時、ページを追加しています。グラフのデータは、右上部分の操作でダウンロードすることができます。アメリカの「地域別の変数」を前処理して、「州別」での推移をグラフ化できるようにしました。また、州コードのフィールドを作成してコロプレス地図も作成しています。楽天ブログでは「iframe」タグが使えないので、Bloggerのページから利用できるようにしています。無料で利用できる、グーグルの「データポータル」のダッシュボードです。データさえあれば、簡単に作成できます。「国」別、「地域」別に日ごとの感染者数の推移を見ることができます。↓ダッシュボードの試作です。下記リンクのページから利用できます。ジョンズ・ホプキンス大学の「JHU CSSE」の「Covid19 Daily Reports」のデータを利用しています。 EdgeブラウザやIEブラウザなど、Chromeブラウザ以外での利用の場合はうまく表示されないことがあるようです。↓上記のダッシュボードのデータの出所のサイトです。マップがメインのダッシュボードです-----------------------------------------------------------------------------------------↓日本のインフルエンザの「定点当たり報告数」をグラフ化できるダッシュボードを試作。都道府県別にグラフ化可能です。--------------------------------------------------------------------------★おすすめの記事 ◆How Windows Sonic looks like.:Windows Sonic for Headphonesの音声と2chステレオ音声の比較:7.1.2chテストトーンの比較で明らかになった違い:一目で違いがわかりました----------------------------------------------------------------------------------------------------------
2020.09.14
コメント(0)
-
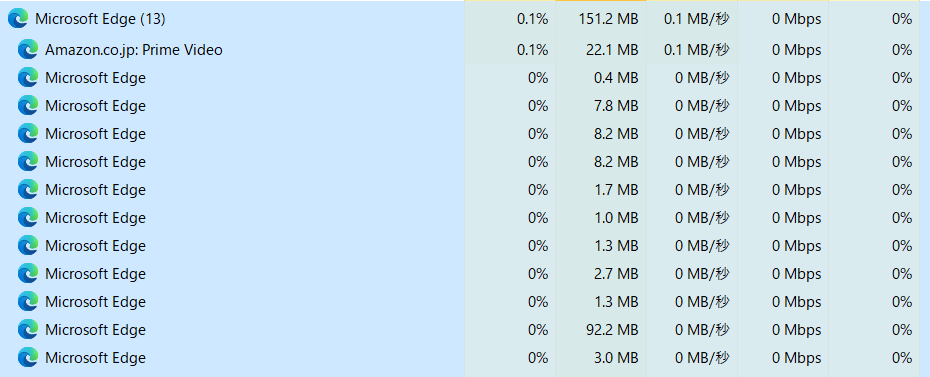
◆【アマゾン・プライム・ビデオ】Windows 10のストアアプリは、Microsoft Edgeがベースになっているようです
アマゾン・プライム・ビデオのWindows 10のストアアプリは、Microsoft Edgeがベースになっているようです。アマゾン・プライム・ビデオのWindows をのストアアプリを起動して、タスクマネージャーを見ると、下図のようにMicrosoft Edgeが起動していることが確認できます。もちろん、Microsoft Edgeブラウザは起動していない状態です。ということは、アマゾン・プライム・ビデオは、Microsoft Edgeブラウザで再生しても、Windows 10のストアアプリで再生しても同じ品質であるようです。↓タスクマネージャーでは、Microsoft Edgeとして表示されます。どういうわけか、Microsoft Edgeがたくさん起動しているように見えます。------------------------------------------------------------------------------------------------------------------------------------------------------------------楽天市場で「マスク」を検索する楽天市場で「ポビドンヨード」を検索する楽天市場で「イソジン うがい薬」を探す楽天市場で「うがい薬」を検索する楽天市場で「マウスウォッシュ・洗口液」を探す-----------------------------------------------------------------------楽天市場で「フコイダン」を探す-----------------------------------------------------------------------↓うがいがそれなりに注目されているようですが、臨床研究はまだこれからのようです。↓口腔衛生に注目し、うがいの効果についてまとめられている論文です。日本の水道水によるうがいも効果がないわけではないようです。昔のカルキ臭の強い水道水の方が効果があるのでしょうか。そういえば、冷蔵庫の製氷機にはミネラルウォーターではなく、水道水を用いることが求められています。AQUOS sense3 lite+Rakuten UN-LIMITプランセット(事務手数料3300円込)【22000円相当のポイント還元】価格:31280円(税別、送料別)(2020/7/15時点)楽天で購入ついに、AQUOS sense3 liteも高額ポイントの対象になりました。マイナンバーカードの読み取りに対応している機種です。----------------------------------------------------------------------------------Galaxy A7+Rakuten UN-LIMITプランセット(事務手数料3300円込)【15000円相当のポイント還元】価格:22000円(税込、送料無料) (2020/5/31時点)楽天で購入↑楽天市場店で購入すればよかったと思います:アマゾン・プライム・ビデオはHD 1080Pで視聴できます:有機ELなので、黒がきれいです:ヘッドホンでのドルビーアトモスに対応しています。-------------------------------------------------------------------------↓楽天市場以外の有名ストアの利用でも楽天ポイントが貯まります。----------------------------------------------------------------------------------------------------------------------------------------------------------------------------------------------------------------【ダッシュボード「COVID-19 Transition Graphs」を試作】こちらは、ジョンズ・ホプキンス大学のデータを利用したダッシュボードです。中国本土以外の地域への感染が拡大しているため、国別、地域別の感染者数の推移を簡単に確認できるダッシュボードを試作しています。随時、ページを追加しています。グラフのデータは、右上部分の操作でダウンロードすることができます。アメリカの「地域別の変数」を前処理して、「州別」での推移をグラフ化できるようにしました。また、州コードのフィールドを作成してコロプレス地図も作成しています。楽天ブログでは「iframe」タグが使えないので、Bloggerのページから利用できるようにしています。無料で利用できる、グーグルの「データポータル」のダッシュボードです。データさえあれば、簡単に作成できます。「国」別、「地域」別に日ごとの感染者数の推移を見ることができます。↓ダッシュボードの試作です。下記リンクのページから利用できます。ジョンズ・ホプキンス大学の「JHU CSSE」の「Covid19 Daily Reports」のデータを利用しています。 EdgeブラウザやIEブラウザなど、Chromeブラウザ以外での利用の場合はうまく表示されないことがあるようです。↓上記のダッシュボードのデータの出所のサイトです。マップがメインのダッシュボードです-----------------------------------------------------------------------------------------↓日本のインフルエンザの「定点当たり報告数」をグラフ化できるダッシュボードを試作。都道府県別にグラフ化可能です。--------------------------------------------------------------------------★おすすめの記事 ◆How Windows Sonic looks like.:Windows Sonic for Headphonesの音声と2chステレオ音声の比較:7.1.2chテストトーンの比較で明らかになった違い:一目で違いがわかりました----------------------------------------------------------------------------------------------------------
2020.09.13
コメント(0)
-

◆【ラジオ】今晩は、第17回「村上RADIO」(19時~)の放送があります
今晩は、第17回目の「村上RADIO」の放送があります。テーマは、クラッシック音楽です。バッハのゴルトベルク変奏曲とかワグナーのニュルンベルクのマイスタージンガーとかは選ばれているでしょうか。どんな楽曲が選ばれているのか、楽しみです。------------------------------------------------------------------------------------------------------------------------------------------------------------------楽天市場で「マスク」を検索する楽天市場で「ポビドンヨード」を検索する楽天市場で「イソジン うがい薬」を探す楽天市場で「うがい薬」を検索する楽天市場で「マウスウォッシュ・洗口液」を探す-----------------------------------------------------------------------楽天市場で「フコイダン」を探す-----------------------------------------------------------------------↓うがいがそれなりに注目されているようですが、臨床研究はまだこれからのようです。↓口腔衛生に注目し、うがいの効果についてまとめられている論文です。日本の水道水によるうがいも効果がないわけではないようです。昔のカルキ臭の強い水道水の方が効果があるのでしょうか。そういえば、冷蔵庫の製氷機にはミネラルウォーターではなく、水道水を用いることが求められています。AQUOS sense3 lite+Rakuten UN-LIMITプランセット(事務手数料3300円込)【22000円相当のポイント還元】価格:31280円(税別、送料別)(2020/7/15時点)楽天で購入ついに、AQUOS sense3 liteも高額ポイントの対象になりました。マイナンバーカードの読み取りに対応している機種です。----------------------------------------------------------------------------------Galaxy A7+Rakuten UN-LIMITプランセット(事務手数料3300円込)【15000円相当のポイント還元】価格:22000円(税込、送料無料) (2020/5/31時点)楽天で購入↑楽天市場店で購入すればよかったと思います:アマゾン・プライム・ビデオはHD 1080Pで視聴できます:有機ELなので、黒がきれいです:ヘッドホンでのドルビーアトモスに対応しています。-------------------------------------------------------------------------↓楽天市場以外の有名ストアの利用でも楽天ポイントが貯まります。----------------------------------------------------------------------------------------------------------------------------------------------------------------------------------------------------------------【ダッシュボード「COVID-19 Transition Graphs」を試作】こちらは、ジョンズ・ホプキンス大学のデータを利用したダッシュボードです。中国本土以外の地域への感染が拡大しているため、国別、地域別の感染者数の推移を簡単に確認できるダッシュボードを試作しています。随時、ページを追加しています。グラフのデータは、右上部分の操作でダウンロードすることができます。アメリカの「地域別の変数」を前処理して、「州別」での推移をグラフ化できるようにしました。また、州コードのフィールドを作成してコロプレス地図も作成しています。楽天ブログでは「iframe」タグが使えないので、Bloggerのページから利用できるようにしています。無料で利用できる、グーグルの「データポータル」のダッシュボードです。データさえあれば、簡単に作成できます。「国」別、「地域」別に日ごとの感染者数の推移を見ることができます。↓ダッシュボードの試作です。下記リンクのページから利用できます。ジョンズ・ホプキンス大学の「JHU CSSE」の「Covid19 Daily Reports」のデータを利用しています。 EdgeブラウザやIEブラウザなど、Chromeブラウザ以外での利用の場合はうまく表示されないことがあるようです。↓上記のダッシュボードのデータの出所のサイトです。マップがメインのダッシュボードです-----------------------------------------------------------------------------------------↓日本のインフルエンザの「定点当たり報告数」をグラフ化できるダッシュボードを試作。都道府県別にグラフ化可能です。--------------------------------------------------------------------------★おすすめの記事 ◆How Windows Sonic looks like.:Windows Sonic for Headphonesの音声と2chステレオ音声の比較:7.1.2chテストトーンの比較で明らかになった違い:一目で違いがわかりました----------------------------------------------------------------------------------------------------------
2020.09.13
コメント(0)
-
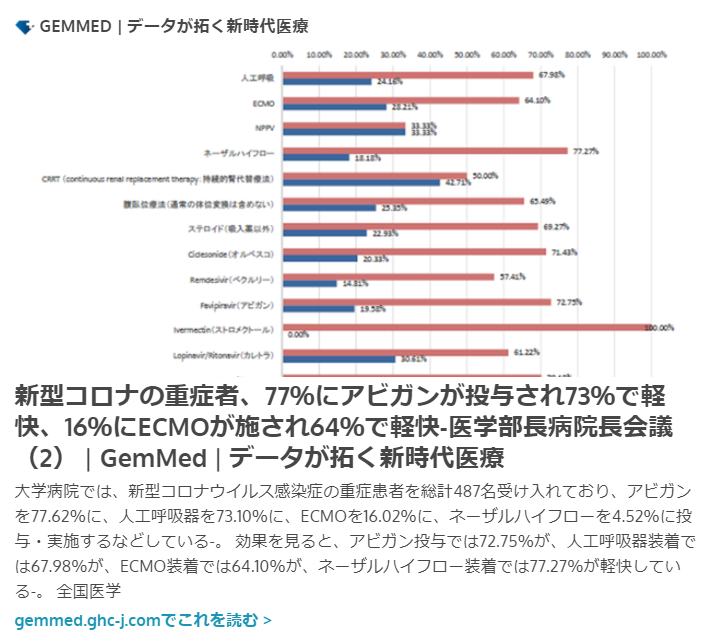
◆【新型コロナ】実は、承認薬のレムデシビル、デキサメタゾンが使わていないようです:使われているのは新型コロナ向けには未承認の薬ばかりのようです
新形コロナウイルス感染症の治療で、実際に使われている薬はアビガンやオルベスコなど、新形コロナウイルス感染症の治療用途にはまだ承認されていない薬ばかりが使用されているようです。アビガンの臨床試験の結果は、もうすぐ出てくるようですが、効果が未確認で、承認もされていない状況で、たくさん利用されている状況というのはどうなのでしょう。臨床試験の結果で、アビガンに「効果なし」となった場合は、もう使われなくなるのでしょうか。一方、承認薬の「レムデシビル」や「デキサメタゾン」が使われていないようですが、これはどういうことなのでしょうか。「レムデシビル」は入手が困難なのでしょうか。承認薬が使われず、未承認薬ばかりが使われている状況を厚生労働省はどのように見ているのでしょうか。厚生労働省は、有効な治療薬・治療法の探索、臨床試験などにもっと予算を投下すべきだと思います。------------------------------------------------------------------------------------------------------------------------------------------------------------------楽天市場で「マスク」を検索する楽天市場で「ポビドンヨード」を検索する楽天市場で「イソジン うがい薬」を探す楽天市場で「うがい薬」を検索する楽天市場で「マウスウォッシュ・洗口液」を探す-----------------------------------------------------------------------楽天市場で「フコイダン」を探す-----------------------------------------------------------------------↓うがいがそれなりに注目されているようですが、臨床研究はまだこれからのようです。↓口腔衛生に注目し、うがいの効果についてまとめられている論文です。日本の水道水によるうがいも効果がないわけではないようです。昔のカルキ臭の強い水道水の方が効果があるのでしょうか。そういえば、冷蔵庫の製氷機にはミネラルウォーターではなく、水道水を用いることが求められています。AQUOS sense3 lite+Rakuten UN-LIMITプランセット(事務手数料3300円込)【22000円相当のポイント還元】価格:31280円(税別、送料別)(2020/7/15時点)楽天で購入ついに、AQUOS sense3 liteも高額ポイントの対象になりました。マイナンバーカードの読み取りに対応している機種です。----------------------------------------------------------------------------------Galaxy A7+Rakuten UN-LIMITプランセット(事務手数料3300円込)【15000円相当のポイント還元】価格:22000円(税込、送料無料) (2020/5/31時点)楽天で購入↑楽天市場店で購入すればよかったと思います:アマゾン・プライム・ビデオはHD 1080Pで視聴できます:有機ELなので、黒がきれいです:ヘッドホンでのドルビーアトモスに対応しています。-------------------------------------------------------------------------↓楽天市場以外の有名ストアの利用でも楽天ポイントが貯まります。----------------------------------------------------------------------------------------------------------------------------------------------------------------------------------------------------------------【ダッシュボード「COVID-19 Transition Graphs」を試作】こちらは、ジョンズ・ホプキンス大学のデータを利用したダッシュボードです。中国本土以外の地域への感染が拡大しているため、国別、地域別の感染者数の推移を簡単に確認できるダッシュボードを試作しています。随時、ページを追加しています。グラフのデータは、右上部分の操作でダウンロードすることができます。アメリカの「地域別の変数」を前処理して、「州別」での推移をグラフ化できるようにしました。また、州コードのフィールドを作成してコロプレス地図も作成しています。楽天ブログでは「iframe」タグが使えないので、Bloggerのページから利用できるようにしています。無料で利用できる、グーグルの「データポータル」のダッシュボードです。データさえあれば、簡単に作成できます。「国」別、「地域」別に日ごとの感染者数の推移を見ることができます。↓ダッシュボードの試作です。下記リンクのページから利用できます。ジョンズ・ホプキンス大学の「JHU CSSE」の「Covid19 Daily Reports」のデータを利用しています。 EdgeブラウザやIEブラウザなど、Chromeブラウザ以外での利用の場合はうまく表示されないことがあるようです。↓上記のダッシュボードのデータの出所のサイトです。マップがメインのダッシュボードです-----------------------------------------------------------------------------------------↓日本のインフルエンザの「定点当たり報告数」をグラフ化できるダッシュボードを試作。都道府県別にグラフ化可能です。--------------------------------------------------------------------------★おすすめの記事 ◆How Windows Sonic looks like.:Windows Sonic for Headphonesの音声と2chステレオ音声の比較:7.1.2chテストトーンの比較で明らかになった違い:一目で違いがわかりました----------------------------------------------------------------------------------------------------------
2020.09.12
コメント(0)
-
◆【新型コロナ】訂正対応の超簡単な体温の記録方法:Power AppsのアプリでExcelファイルにデータを入力できます:職場などでの利用に最適です
Microsoft Formsを利用して、Excelシートにデータを入力する方法は、Office 365(Microsoft 365)ユーザーでなくても利用できます。誰でも利用できるという点で非常に手軽ですが、入力データを送信した後は訂正ができません。ただし、職場内などでMicrosoft Formsのデータを保存するExcelファイルを共有して、修正できるような形で運用することは可能だと思います。その場合は、「Excel OnlineアプリからFormsを作成する方法」が適していると思います。そのExcelファイルのデータからPower BIのレポートを作成することができるので、データをモニターすることも簡単にできます。さて、MicrosoftのPower Appsを利用する方法は、利用者が限られますが、入力データをスマホアプリから修正することができるので、使い勝手はかなりいいと思います。Office 365(Microsoft 365)を導入している職場などでは、MicrosoftのPower Appsを利用するのがおすすめです。MicrosoftのPower Appsは、ビジネス向けのスマホアプリを超簡単に作成できるツールです。毎日の体温の記録をスマホからExcelファイルに保存していくことができる、MicrosoftのPower Appsを使う方法は手軽で、便利な方法だと思います。特に、パソコンを起動する必要がないという点がいいと思います。ExcelファイルやSharePointのリストにデータを入力するスマホアプリであれば、まったく初めての場合でも2時間くらいで作成することができます。ある程度、手順がわかっているのであれば、1時間もかからずに作成できると思います。Excelファイルと連携するアプリのイメージとしては、表形式のデータの読み書きができる機能を持ったアプリということになると思います。作成手順:Office 365 Pro Plusの環境で作成してみました。Excelファイルを利用する場合は、まず、Excelファイルにデータを入力する列を作成します。データの入れものを作成して、Power AppsでそのExcelファイルに接続すると、自動でアプリが作成される仕組みです。1.マイクロソフトのクラウドドライブの「OneDrive」の中にExcelファイルを作成します。2.Excelファイルに、「1.検温日」「2.名前」「3.体温」「4.症状の有無」「5.備考」といったデータ入力のための列のヘッダーを作成します。1行分のデータを仮に入力しておきます。次に、ヘッダーとデータを仮に入力した範囲を「テーブル」に設定して、Excelファイルを閉じます。なお、「1.」といった番号を列名に付けるのは、Power Appsでアプリを作成する際に自動作成される入力欄の順番が列の順番と一致するようにするためです。3.Power AppsのサイトからOneDriveの当該Excelファイルの当該テーブルに接続します。すると、自動的にデータ入力用アプリが生成されます。このままでも、データ入力アプリとして利用することができます。4.Power Appsの各画面のタイトル名の変更などの微調整をします。検温日のデフォルトの日付を「Today()」にしたり、症状の有無をプルダウン選択式にしたり、細かなところを調整します。5.スマホに「Power Appsアプリ」をインストールします。Power Appsアプリから、作成したアプリを利用することができます。測定した体温のデータを入力します。6.必須ではありませんが、Power BI Desktopで当該Excelファイルに接続してデータを取得します。検温データについてのレポートを作成します。レポートで検温データについての情報を見ることができるようになります。Excelファイルを開いている間は、Power Appsで入力ができないようなので、Power BIで情報を見るという方法は便利だと思います。あるいは、Power BIを使わずにデータ閲覧用のExcelファイルを用意して、記録用のExcelファイルのデータテーブルをインポートする方法もあります。↓Power Appsで作成されたアプリの入力画面です↓Power BIのレポート画面で、入力された体温の情報を確認できます。↓Power Appsでマイクロソフトが作成した新型コロナの軽症者の健康状態管理アプリの例です。軽症者にユーザーIDを発行して運用する仕組みになっています。Office 365(Microsoft 365)などのサービスがベースになっているようです。------------------------------------------------------------------------------------------------------------------------------------------------------------------楽天市場で「マスク」を検索する楽天市場で「ポビドンヨード」を検索する楽天市場で「イソジン うがい薬」を探す楽天市場で「うがい薬」を検索する楽天市場で「マウスウォッシュ・洗口液」を探す-----------------------------------------------------------------------楽天市場で「フコイダン」を探す-----------------------------------------------------------------------↓うがいがそれなりに注目されているようですが、臨床研究はまだこれからのようです。↓口腔衛生に注目し、うがいの効果についてまとめられている論文です。日本の水道水によるうがいも効果がないわけではないようです。昔のカルキ臭の強い水道水の方が効果があるのでしょうか。そういえば、冷蔵庫の製氷機にはミネラルウォーターではなく、水道水を用いることが求められています。AQUOS sense3 lite+Rakuten UN-LIMITプランセット(事務手数料3300円込)【22000円相当のポイント還元】価格:31280円(税別、送料別)(2020/7/15時点)楽天で購入ついに、AQUOS sense3 liteも高額ポイントの対象になりました。マイナンバーカードの読み取りに対応している機種です。----------------------------------------------------------------------------------Galaxy A7+Rakuten UN-LIMITプランセット(事務手数料3300円込)【15000円相当のポイント還元】価格:22000円(税込、送料無料) (2020/5/31時点)楽天で購入↑楽天市場店で購入すればよかったと思います:アマゾン・プライム・ビデオはHD 1080Pで視聴できます:有機ELなので、黒がきれいです:ヘッドホンでのドルビーアトモスに対応しています。-------------------------------------------------------------------------↓楽天市場以外の有名ストアの利用でも楽天ポイントが貯まります。----------------------------------------------------------------------------------------------------------------------------------------------------------------------------------------------------------------【ダッシュボード「COVID-19 Transition Graphs」を試作】こちらは、ジョンズ・ホプキンス大学のデータを利用したダッシュボードです。中国本土以外の地域への感染が拡大しているため、国別、地域別の感染者数の推移を簡単に確認できるダッシュボードを試作しています。随時、ページを追加しています。グラフのデータは、右上部分の操作でダウンロードすることができます。アメリカの「地域別の変数」を前処理して、「州別」での推移をグラフ化できるようにしました。また、州コードのフィールドを作成してコロプレス地図も作成しています。楽天ブログでは「iframe」タグが使えないので、Bloggerのページから利用できるようにしています。無料で利用できる、グーグルの「データポータル」のダッシュボードです。データさえあれば、簡単に作成できます。「国」別、「地域」別に日ごとの感染者数の推移を見ることができます。↓ダッシュボードの試作です。下記リンクのページから利用できます。ジョンズ・ホプキンス大学の「JHU CSSE」の「Covid19 Daily Reports」のデータを利用しています。 EdgeブラウザやIEブラウザなど、Chromeブラウザ以外での利用の場合はうまく表示されないことがあるようです。↓上記のダッシュボードのデータの出所のサイトです。マップがメインのダッシュボードです-----------------------------------------------------------------------------------------↓日本のインフルエンザの「定点当たり報告数」をグラフ化できるダッシュボードを試作。都道府県別にグラフ化可能です。--------------------------------------------------------------------------★おすすめの記事 ◆How Windows Sonic looks like.:Windows Sonic for Headphonesの音声と2chステレオ音声の比較:7.1.2chテストトーンの比較で明らかになった違い:一目で違いがわかりました----------------------------------------------------------------------------------------------------------
2020.09.11
コメント(0)
-
◆【新型コロナ】毎日の体温記録を超簡単にできるMicrosoft Forms:無料のWeb 版 Officeでも利用できます:Office 365 Business導入企業であれば、社員のデータ収集も簡単に自動化できます
今さらですが、毎日の体温データの記録などを省力化する方法として、Microsoft Formsはかなり使えるのではないかと思いました。Microsoft Formsを利用すれば、「体温記録用アプリ」などは不要だと思います。Microsoft Formsは、Web 版 Officeの一部として利用できるので、Microsoftアカウントがあれば無料で利用できます。非常に手軽に利用できるので、勉強会や飲み会、食事会などの出欠確認とか、いろいろと利用範囲は広そうです。Google フォームでも、無料で同様のことができるようですが、とりあえず、今回はMicrosoft Formsについて紹介します。例えば、家族の体温の記録を一元管理したい場合などに便利だと思います。自分1人だけの場合でも、Excelファイルを開いてデータを入力するといった手間が省けます。もちろん、家族のそれぞれに、専用のデータ入力画面を用意することもできます。職場などで、紙ベースで記録しているのであれば、今すぐにMicrosoft Formsを利用した方式に切り替えるべきです。社員一人ひとりに専用の入力画面を用意すれば、一人ずつのExcelシートが作成されます。デジタルデータなので、コピペで集約することも簡単にできます。部単位や課単位で入力するようにしてもいいかもしれません。Microsoft Formsを利用する方法は、Excelシートの共有による入力よりもスマートです。弱点は、一度送信してしまうと修正できない点ですが、「修正・再送」といった入力項目を設けておけば修正の再送信を区別できると思います。あるいは、Excel OnlineアプリからFormsを作成し、データが記録されるExcelファイルを共有して、各自が訂正できるような形の運用も可能だと思います。もちろん、管理者に修正を依頼するような運用でもいいでしょう。Microsoft Formsでは、web上にアンケート画面(データ入力画面)をとても簡単に作成できます。症状の有無や体調に関する質問を付け加えるなど、質問数が多い場合でも手早く作成することができます。家族での利用であれば、名前の入力を選択肢方式にすればテキスト入力の手間を省けたりします。また、体温の数字入力も選択肢方式にすることが可能です。選択肢方式の回答であれば、結果をグラフで確認することもできます。そして、作成したアンケート画面のURL、QRコードを利用者にメールやサイトを通じて配布します。後は、アンケート画面に沿って利用者が入力するだけです。手順としては、以下のようになります。なお、下記の方法とは別に、Excel OnlineでExcelファイルを作成して、ExcelのメニューからFormsを作成する、という方法もあります。この場合、ExcelファイルとPower BI Desktopを接続して、Power BIのレポート作成も簡単にできます。1.Microsoft Formsのサイトでアンケート画面(データ入力画面)を作成2.アンケート画面(データ入力画面)のURLの配布3.利用者がスマホ、タブレット、パソコンなどのブラウザからデータを入力4.Excelシートで入力されたデータを確認できますつまり、Microsoft Formsを利用すると、Excelシートを開かずに、スマホやタブレット、パソコンなどのブラウザからExcelシートにデータを記入することができる、ということになります。↓スマホでの入力画面イメージ。日付入力はカレンダーから選択する方式です。毎日入力すれば、毎日、データが蓄積されていきます。↓パソコンでの入力画面↓アンケート画面の作成はとても簡単にできます。↓入力データは、Excelシートに収容されます。回答日時が自動で記録されます。なお、Office 365 Business導入企業の中で利用する場合は、「所属組織内限定」の運用にすれば、メールアドレスと名前が自動で入力されます。---------------------------------------------------------------------------------------------------------------------------------------------------------------------------------------------------------------------------------------------------------------楽天市場で「マスク」を検索する楽天市場で「ポビドンヨード」を検索する楽天市場で「イソジン うがい薬」を探す楽天市場で「うがい薬」を検索する楽天市場で「マウスウォッシュ・洗口液」を探す-----------------------------------------------------------------------楽天市場で「フコイダン」を探す-----------------------------------------------------------------------↓うがいがそれなりに注目されているようですが、臨床研究はまだこれからのようです。↓口腔衛生に注目し、うがいの効果についてまとめられている論文です。日本の水道水によるうがいも効果がないわけではないようです。昔のカルキ臭の強い水道水の方が効果があるのでしょうか。そういえば、冷蔵庫の製氷機にはミネラルウォーターではなく、水道水を用いることが求められています。AQUOS sense3 lite+Rakuten UN-LIMITプランセット(事務手数料3300円込)【22000円相当のポイント還元】価格:31280円(税別、送料別)(2020/7/15時点)楽天で購入ついに、AQUOS sense3 liteも高額ポイントの対象になりました。マイナンバーカードの読み取りに対応している機種です。----------------------------------------------------------------------------------Galaxy A7+Rakuten UN-LIMITプランセット(事務手数料3300円込)【15000円相当のポイント還元】価格:22000円(税込、送料無料) (2020/5/31時点)楽天で購入↑楽天市場店で購入すればよかったと思います:アマゾン・プライム・ビデオはHD 1080Pで視聴できます:有機ELなので、黒がきれいです:ヘッドホンでのドルビーアトモスに対応しています。-------------------------------------------------------------------------↓楽天市場以外の有名ストアの利用でも楽天ポイントが貯まります。----------------------------------------------------------------------------------------------------------------------------------------------------------------------------------------------------------------【ダッシュボード「COVID-19 Transition Graphs」を試作】こちらは、ジョンズ・ホプキンス大学のデータを利用したダッシュボードです。中国本土以外の地域への感染が拡大しているため、国別、地域別の感染者数の推移を簡単に確認できるダッシュボードを試作しています。随時、ページを追加しています。グラフのデータは、右上部分の操作でダウンロードすることができます。アメリカの「地域別の変数」を前処理して、「州別」での推移をグラフ化できるようにしました。また、州コードのフィールドを作成してコロプレス地図も作成しています。楽天ブログでは「iframe」タグが使えないので、Bloggerのページから利用できるようにしています。無料で利用できる、グーグルの「データポータル」のダッシュボードです。データさえあれば、簡単に作成できます。「国」別、「地域」別に日ごとの感染者数の推移を見ることができます。↓ダッシュボードの試作です。下記リンクのページから利用できます。ジョンズ・ホプキンス大学の「JHU CSSE」の「Covid19 Daily Reports」のデータを利用しています。 EdgeブラウザやIEブラウザなど、Chromeブラウザ以外での利用の場合はうまく表示されないことがあるようです。↓上記のダッシュボードのデータの出所のサイトです。マップがメインのダッシュボードです-----------------------------------------------------------------------------------------↓日本のインフルエンザの「定点当たり報告数」をグラフ化できるダッシュボードを試作。都道府県別にグラフ化可能です。--------------------------------------------------------------------------★おすすめの記事 ◆How Windows Sonic looks like.:Windows Sonic for Headphonesの音声と2chステレオ音声の比較:7.1.2chテストトーンの比較で明らかになった違い:一目で違いがわかりました----------------------------------------------------------------------------------------------------------
2020.09.10
コメント(0)
-
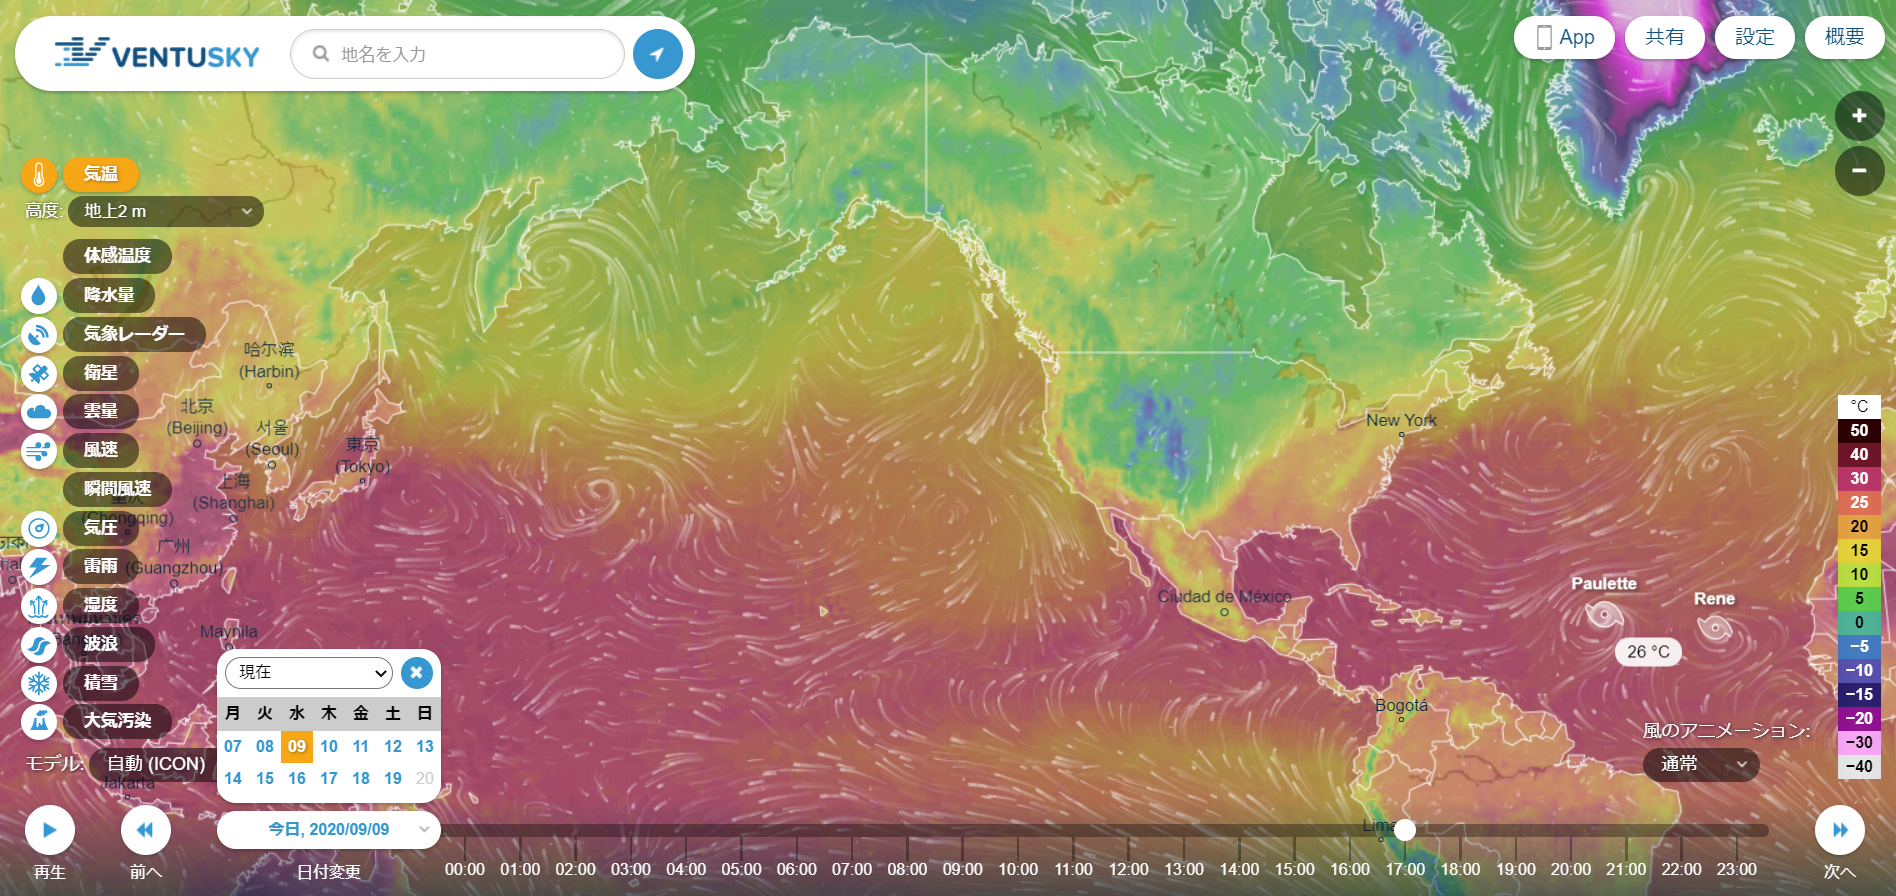
◆熱波の2日後に寒波到来:こんなことってあるのでしょうか:米国の内陸部では氷点下のところもあります
米国のコロラド州で、熱波が到来していた2日後に寒波が到来、という珍しいことが起きているようです。確かに、Ventuskyの気象図で気温を見ると、カナダから寒気団が南下してきていて、米国の内陸部では氷点下のところがあります。------------------------------------------------------------------------------------------------------------------------------------------------------------------楽天市場で「マスク」を検索する楽天市場で「ポビドンヨード」を検索する楽天市場で「イソジン うがい薬」を探す楽天市場で「うがい薬」を検索する楽天市場で「マウスウォッシュ・洗口液」を探す-----------------------------------------------------------------------楽天市場で「フコイダン」を探す-----------------------------------------------------------------------↓うがいがそれなりに注目されているようですが、臨床研究はまだこれからのようです。↓口腔衛生に注目し、うがいの効果についてまとめられている論文です。日本の水道水によるうがいも効果がないわけではないようです。昔のカルキ臭の強い水道水の方が効果があるのでしょうか。そういえば、冷蔵庫の製氷機にはミネラルウォーターではなく、水道水を用いることが求められています。AQUOS sense3 lite+Rakuten UN-LIMITプランセット(事務手数料3300円込)【22000円相当のポイント還元】価格:31280円(税別、送料別)(2020/7/15時点)楽天で購入ついに、AQUOS sense3 liteも高額ポイントの対象になりました。マイナンバーカードの読み取りに対応している機種です。----------------------------------------------------------------------------------Galaxy A7+Rakuten UN-LIMITプランセット(事務手数料3300円込)【15000円相当のポイント還元】価格:22000円(税込、送料無料) (2020/5/31時点)楽天で購入↑楽天市場店で購入すればよかったと思います:アマゾン・プライム・ビデオはHD 1080Pで視聴できます:有機ELなので、黒がきれいです:ヘッドホンでのドルビーアトモスに対応しています。-------------------------------------------------------------------------↓楽天市場以外の有名ストアの利用でも楽天ポイントが貯まります。----------------------------------------------------------------------------------------------------------------------------------------------------------------------------------------------------------------【ダッシュボード「COVID-19 Transition Graphs」を試作】こちらは、ジョンズ・ホプキンス大学のデータを利用したダッシュボードです。中国本土以外の地域への感染が拡大しているため、国別、地域別の感染者数の推移を簡単に確認できるダッシュボードを試作しています。随時、ページを追加しています。グラフのデータは、右上部分の操作でダウンロードすることができます。アメリカの「地域別の変数」を前処理して、「州別」での推移をグラフ化できるようにしました。また、州コードのフィールドを作成してコロプレス地図も作成しています。楽天ブログでは「iframe」タグが使えないので、Bloggerのページから利用できるようにしています。無料で利用できる、グーグルの「データポータル」のダッシュボードです。データさえあれば、簡単に作成できます。「国」別、「地域」別に日ごとの感染者数の推移を見ることができます。↓ダッシュボードの試作です。下記リンクのページから利用できます。ジョンズ・ホプキンス大学の「JHU CSSE」の「Covid19 Daily Reports」のデータを利用しています。 EdgeブラウザやIEブラウザなど、Chromeブラウザ以外での利用の場合はうまく表示されないことがあるようです。↓上記のダッシュボードのデータの出所のサイトです。マップがメインのダッシュボードです-----------------------------------------------------------------------------------------↓日本のインフルエンザの「定点当たり報告数」をグラフ化できるダッシュボードを試作。都道府県別にグラフ化可能です。--------------------------------------------------------------------------★おすすめの記事 ◆How Windows Sonic looks like.:Windows Sonic for Headphonesの音声と2chステレオ音声の比較:7.1.2chテストトーンの比較で明らかになった違い:一目で違いがわかりました----------------------------------------------------------------------------------------------------------
2020.09.09
コメント(0)
-

◆【新型コロナ】前年同月比は3.1%の水準(マイナス96.9%)。東京都区部の映画・演劇等入場料などへの支出は低迷続く:総務省「家計調査」から
総務省「家計調査」の二人以上の世帯のデータによると、東京都区部の映画・演劇等入場料の支出は低迷しています。7月の前年同月比は3.1%という、ほとんどゼロに近い水準になっています。映画の場合は、上映されている作品のラインアップも影響していると思われますが、前年と比べて映画・演劇への支出が蒸発してしまっていることがわかります。さすがに、自粛が行き過ぎなのではないかと思いますが、「死亡者数は40万人になる」とか言われていたので、自粛してきたのも仕方がないと思います。政府は、新形コロナウイルスについてのリスクについての評価を早急に行う必要があるのではないでしょうか。ダッシュボードでは、家計調査の一部の品目について、都市別に前年同月比の推移を見られるようにしています。↓上記のグラフは、ダッシュボードからの抜粋です。下記のページから利用できます。都市別のデータも見ることができます。----------------------------------------------------------------------楽天市場で「マスク」を検索する楽天市場で「ポビドンヨード」を検索する楽天市場で「イソジン うがい薬」を探す楽天市場で「うがい薬」を検索する楽天市場で「マウスウォッシュ・洗口液」を探す-----------------------------------------------------------------------楽天市場で「フコイダン」を探す-----------------------------------------------------------------------↓うがいがそれなりに注目されているようですが、臨床研究はまだこれからのようです。↓口腔衛生に注目し、うがいの効果についてまとめられている論文です。日本の水道水によるうがいも効果がないわけではないようです。昔のカルキ臭の強い水道水の方が効果があるのでしょうか。そういえば、冷蔵庫の製氷機にはミネラルウォーターではなく、水道水を用いることが求められています。AQUOS sense3 lite+Rakuten UN-LIMITプランセット(事務手数料3300円込)【22000円相当のポイント還元】価格:31280円(税別、送料別)(2020/7/15時点)楽天で購入ついに、AQUOS sense3 liteも高額ポイントの対象になりました。マイナンバーカードの読み取りに対応している機種です。----------------------------------------------------------------------------------Galaxy A7+Rakuten UN-LIMITプランセット(事務手数料3300円込)【15000円相当のポイント還元】価格:22000円(税込、送料無料) (2020/5/31時点)楽天で購入↑楽天市場店で購入すればよかったと思います:アマゾン・プライム・ビデオはHD 1080Pで視聴できます:有機ELなので、黒がきれいです:ヘッドホンでのドルビーアトモスに対応しています。-------------------------------------------------------------------------↓楽天市場以外の有名ストアの利用でも楽天ポイントが貯まります。----------------------------------------------------------------------------------------------------------------------------------------------------------------------------------------------------------------【ダッシュボード「COVID-19 Transition Graphs」を試作】こちらは、ジョンズ・ホプキンス大学のデータを利用したダッシュボードです。中国本土以外の地域への感染が拡大しているため、国別、地域別の感染者数の推移を簡単に確認できるダッシュボードを試作しています。随時、ページを追加しています。グラフのデータは、右上部分の操作でダウンロードすることができます。アメリカの「地域別の変数」を前処理して、「州別」での推移をグラフ化できるようにしました。また、州コードのフィールドを作成してコロプレス地図も作成しています。楽天ブログでは「iframe」タグが使えないので、Bloggerのページから利用できるようにしています。無料で利用できる、グーグルの「データポータル」のダッシュボードです。データさえあれば、簡単に作成できます。「国」別、「地域」別に日ごとの感染者数の推移を見ることができます。↓ダッシュボードの試作です。下記リンクのページから利用できます。ジョンズ・ホプキンス大学の「JHU CSSE」の「Covid19 Daily Reports」のデータを利用しています。 EdgeブラウザやIEブラウザなど、Chromeブラウザ以外での利用の場合はうまく表示されないことがあるようです。↓上記のダッシュボードのデータの出所のサイトです。マップがメインのダッシュボードです-----------------------------------------------------------------------------------------↓日本のインフルエンザの「定点当たり報告数」をグラフ化できるダッシュボードを試作。都道府県別にグラフ化可能です。--------------------------------------------------------------------------★おすすめの記事 ◆How Windows Sonic looks like.:Windows Sonic for Headphonesの音声と2chステレオ音声の比較:7.1.2chテストトーンの比較で明らかになった違い:一目で違いがわかりました----------------------------------------------------------------------------------------------------------
2020.09.09
コメント(0)
-
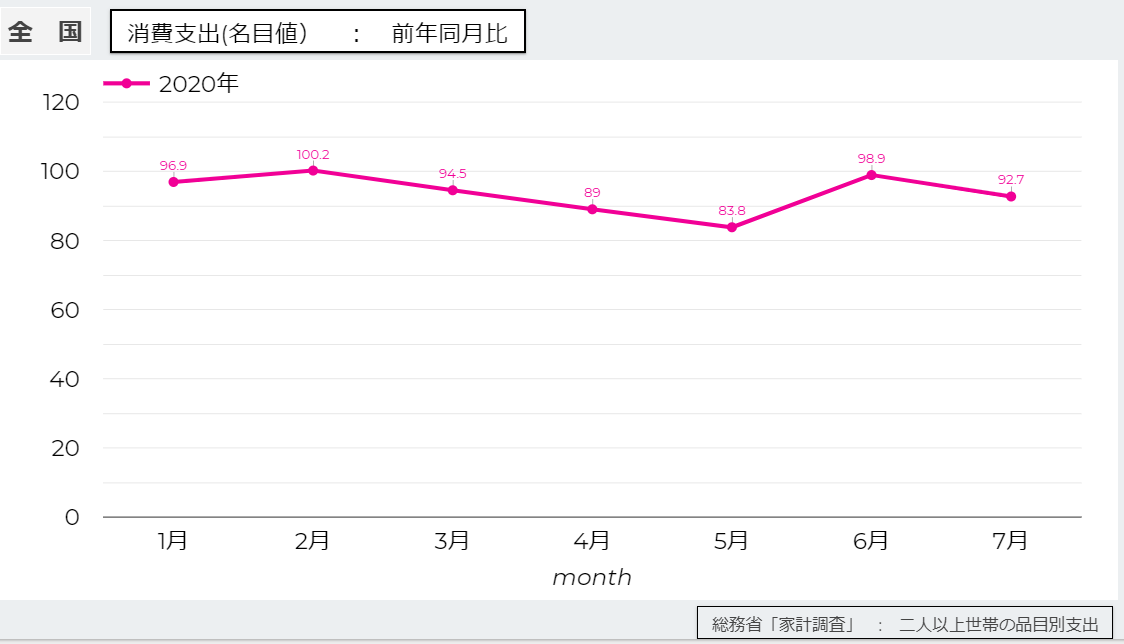
◆【新型コロナ】回復鈍い消費支出:前年同月比でマイナスが続いています:総務省「家計調査」から
家計の消費支出は、V字回復とはなっていないようです。2020年7月の総務省「家計調査」の結果が公表されました。二人以上の世帯の7月の消費支出の前年同月比は、名目でマイナス7.3%、実質でマイナス7.6%となっています。7月の前年同月比の数字は、6月の前年同月比の水準よりも低下しています。ダッシュボードで、外食費、交通費、旅行費、娯楽サービス費などのデータを見られるようにしていますが、大きく落ち込んだ分野での戻りが鈍いことがわかります。↓上記のグラフは、ダッシュボードからの抜粋です。下記のページから利用できます。都市別のデータも見ることができます。----------------------------------------------------------------------楽天市場で「マスク」を検索する楽天市場で「ポビドンヨード」を検索する楽天市場で「イソジン うがい薬」を探す楽天市場で「うがい薬」を検索する楽天市場で「マウスウォッシュ・洗口液」を探す-----------------------------------------------------------------------楽天市場で「フコイダン」を探す-----------------------------------------------------------------------↓うがいがそれなりに注目されているようですが、臨床研究はまだこれからのようです。↓口腔衛生に注目し、うがいの効果についてまとめられている論文です。日本の水道水によるうがいも効果がないわけではないようです。昔のカルキ臭の強い水道水の方が効果があるのでしょうか。そういえば、冷蔵庫の製氷機にはミネラルウォーターではなく、水道水を用いることが求められています。AQUOS sense3 lite+Rakuten UN-LIMITプランセット(事務手数料3300円込)【22000円相当のポイント還元】価格:31280円(税別、送料別)(2020/7/15時点)楽天で購入ついに、AQUOS sense3 liteも高額ポイントの対象になりました。マイナンバーカードの読み取りに対応している機種です。----------------------------------------------------------------------------------Galaxy A7+Rakuten UN-LIMITプランセット(事務手数料3300円込)【15000円相当のポイント還元】価格:22000円(税込、送料無料) (2020/5/31時点)楽天で購入↑楽天市場店で購入すればよかったと思います:アマゾン・プライム・ビデオはHD 1080Pで視聴できます:有機ELなので、黒がきれいです:ヘッドホンでのドルビーアトモスに対応しています。-------------------------------------------------------------------------↓楽天市場以外の有名ストアの利用でも楽天ポイントが貯まります。----------------------------------------------------------------------------------------------------------------------------------------------------------------------------------------------------------------【ダッシュボード「COVID-19 Transition Graphs」を試作】こちらは、ジョンズ・ホプキンス大学のデータを利用したダッシュボードです。中国本土以外の地域への感染が拡大しているため、国別、地域別の感染者数の推移を簡単に確認できるダッシュボードを試作しています。随時、ページを追加しています。グラフのデータは、右上部分の操作でダウンロードすることができます。アメリカの「地域別の変数」を前処理して、「州別」での推移をグラフ化できるようにしました。また、州コードのフィールドを作成してコロプレス地図も作成しています。楽天ブログでは「iframe」タグが使えないので、Bloggerのページから利用できるようにしています。無料で利用できる、グーグルの「データポータル」のダッシュボードです。データさえあれば、簡単に作成できます。「国」別、「地域」別に日ごとの感染者数の推移を見ることができます。↓ダッシュボードの試作です。下記リンクのページから利用できます。ジョンズ・ホプキンス大学の「JHU CSSE」の「Covid19 Daily Reports」のデータを利用しています。 EdgeブラウザやIEブラウザなど、Chromeブラウザ以外での利用の場合はうまく表示されないことがあるようです。↓上記のダッシュボードのデータの出所のサイトです。マップがメインのダッシュボードです-----------------------------------------------------------------------------------------↓日本のインフルエンザの「定点当たり報告数」をグラフ化できるダッシュボードを試作。都道府県別にグラフ化可能です。--------------------------------------------------------------------------★おすすめの記事 ◆How Windows Sonic looks like.:Windows Sonic for Headphonesの音声と2chステレオ音声の比較:7.1.2chテストトーンの比較で明らかになった違い:一目で違いがわかりました----------------------------------------------------------------------------------------------------------
2020.09.08
コメント(0)
-
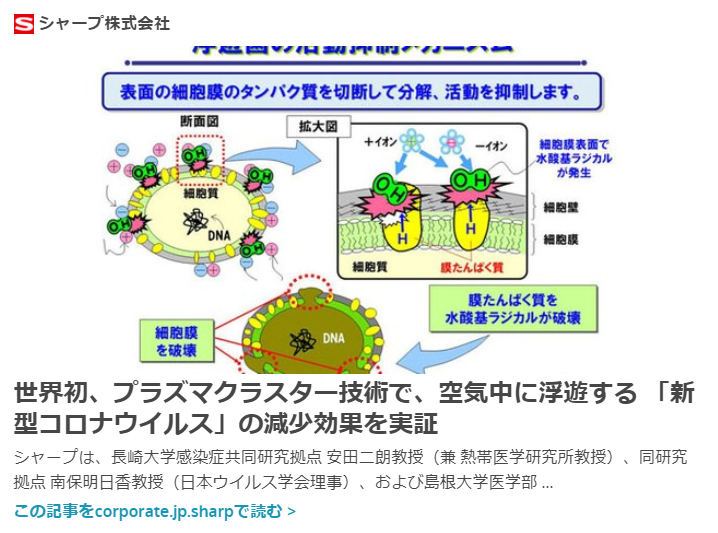
◆【新型コロナ】シャープの「プラズマクラスター」が新型コロナウイルスに対して効果あり
シャープの「プラズマクラスター」が新型コロナウイルスに対して効果があることが実証されたそうです。「プラズマクラスター」が、空気中に浮遊しているウイルスを不活化できるそうです。シャープの空気清浄機やエアコンなどが改めて注目を集めるかもしれません。↓シャープのニュースリリースです。----------------------------------------------------------------------楽天市場で「プラズマクラスター」を検索する楽天市場で「マスク」を検索する楽天市場で「ポビドンヨード」を検索する楽天市場で「イソジン うがい薬」を探す楽天市場で「うがい薬」を検索する楽天市場で「マウスウォッシュ・洗口液」を探す-----------------------------------------------------------------------↓うがいがそれなりに注目されているようですが、臨床研究はまだこれからのようです。↓口腔衛生に注目し、うがいの効果についてまとめられている論文です。日本の水道水によるうがいも効果がないわけではないようです。昔のカルキ臭の強い水道水の方が効果があるのでしょうか。そういえば、冷蔵庫の製氷機にはミネラルウォーターではなく、水道水を用いることが求められています。AQUOS sense3 lite+Rakuten UN-LIMITプランセット(事務手数料3300円込)【22000円相当のポイント還元】価格:31280円(税別、送料別)(2020/7/15時点)楽天で購入ついに、AQUOS sense3 liteも高額ポイントの対象になりました。マイナンバーカードの読み取りに対応している機種です。----------------------------------------------------------------------------------Galaxy A7+Rakuten UN-LIMITプランセット(事務手数料3300円込)【15000円相当のポイント還元】価格:22000円(税込、送料無料) (2020/5/31時点)楽天で購入↑楽天市場店で購入すればよかったと思います:アマゾン・プライム・ビデオはHD 1080Pで視聴できます:有機ELなので、黒がきれいです:ヘッドホンでのドルビーアトモスに対応しています。-------------------------------------------------------------------------↓楽天市場以外の有名ストアの利用でも楽天ポイントが貯まります。----------------------------------------------------------------------------------------------------------------------------------------------------------------------------------------------------------------【ダッシュボード「COVID-19 Transition Graphs」を試作】こちらは、ジョンズ・ホプキンス大学のデータを利用したダッシュボードです。中国本土以外の地域への感染が拡大しているため、国別、地域別の感染者数の推移を簡単に確認できるダッシュボードを試作しています。随時、ページを追加しています。グラフのデータは、右上部分の操作でダウンロードすることができます。アメリカの「地域別の変数」を前処理して、「州別」での推移をグラフ化できるようにしました。また、州コードのフィールドを作成してコロプレス地図も作成しています。楽天ブログでは「iframe」タグが使えないので、Bloggerのページから利用できるようにしています。無料で利用できる、グーグルの「データポータル」のダッシュボードです。データさえあれば、簡単に作成できます。「国」別、「地域」別に日ごとの感染者数の推移を見ることができます。↓ダッシュボードの試作です。下記リンクのページから利用できます。ジョンズ・ホプキンス大学の「JHU CSSE」の「Covid19 Daily Reports」のデータを利用しています。 EdgeブラウザやIEブラウザなど、Chromeブラウザ以外での利用の場合はうまく表示されないことがあるようです。↓上記のダッシュボードのデータの出所のサイトです。マップがメインのダッシュボードです-----------------------------------------------------------------------------------------↓日本のインフルエンザの「定点当たり報告数」をグラフ化できるダッシュボードを試作。都道府県別にグラフ化可能です。--------------------------------------------------------------------------★おすすめの記事 ◆How Windows Sonic looks like.:Windows Sonic for Headphonesの音声と2chステレオ音声の比較:7.1.2chテストトーンの比較で明らかになった違い:一目で違いがわかりました----------------------------------------------------------------------------------------------------------
2020.09.07
コメント(0)
-

◆【アマゾン・プライム・ビデオ】『PREACHER(プリーチャー)』はエピソード6あたりから面白くなりました
アマゾン・プライム・ビデオで配信中の『PREACHER(プリーチャー)』(カルト・コミックの実写ドラマシリーズ)は、第3話くらいまでは「よくわからないドラマだ」という感想でしたが、徐々に全体像が見えてきて、第6話あたりから加速的に面白くなってきます。なお、残酷なシーンが多く、お子様向けでないのは確かです。基本的に、ブラックでシニカルなユーモアのコメディのようです。登場人物についての情報が少しずつ描かれるので、この人はどういう人なのか、ということが最初のうちはわかりません。最初のうちは、謎ばかりで、「面白い」とは思えないのではないかと思います。でも、徐々に面白くなってくるので、シーズン1の最初で観るのをやめた人は、シーズン1の第6話くらいまで観てみると、「面白さ」がわかるのではないかと思います。シーズン1を観終えたところですが、シーズン2以降も観たいと思わせる内容でした。----------------------------------------------------------------------楽天市場で「マスク」を検索する楽天市場で「ポビドンヨード」を検索する楽天市場で「イソジン うがい薬」を探す楽天市場で「うがい薬」を検索する楽天市場で「マウスウォッシュ・洗口液」を探す-----------------------------------------------------------------------↓うがいがそれなりに注目されているようですが、臨床研究はまだこれからのようです。↓口腔衛生に注目し、うがいの効果についてまとめられている論文です。日本の水道水によるうがいも効果がないわけではないようです。昔のカルキ臭の強い水道水の方が効果があるのでしょうか。そういえば、冷蔵庫の製氷機にはミネラルウォーターではなく、水道水を用いることが求められています。AQUOS sense3 lite+Rakuten UN-LIMITプランセット(事務手数料3300円込)【22000円相当のポイント還元】価格:31280円(税別、送料別)(2020/7/15時点)楽天で購入ついに、AQUOS sense3 liteも高額ポイントの対象になりました。マイナンバーカードの読み取りに対応している機種です。----------------------------------------------------------------------------------Galaxy A7+Rakuten UN-LIMITプランセット(事務手数料3300円込)【15000円相当のポイント還元】価格:22000円(税込、送料無料) (2020/5/31時点)楽天で購入↑楽天市場店で購入すればよかったと思います:アマゾン・プライム・ビデオはHD 1080Pで視聴できます:有機ELなので、黒がきれいです:ヘッドホンでのドルビーアトモスに対応しています。-------------------------------------------------------------------------↓楽天市場以外の有名ストアの利用でも楽天ポイントが貯まります。----------------------------------------------------------------------------------------------------------------------------------------------------------------------------------------------------------------【ダッシュボード「COVID-19 Transition Graphs」を試作】こちらは、ジョンズ・ホプキンス大学のデータを利用したダッシュボードです。中国本土以外の地域への感染が拡大しているため、国別、地域別の感染者数の推移を簡単に確認できるダッシュボードを試作しています。随時、ページを追加しています。グラフのデータは、右上部分の操作でダウンロードすることができます。アメリカの「地域別の変数」を前処理して、「州別」での推移をグラフ化できるようにしました。また、州コードのフィールドを作成してコロプレス地図も作成しています。楽天ブログでは「iframe」タグが使えないので、Bloggerのページから利用できるようにしています。無料で利用できる、グーグルの「データポータル」のダッシュボードです。データさえあれば、簡単に作成できます。「国」別、「地域」別に日ごとの感染者数の推移を見ることができます。↓ダッシュボードの試作です。下記リンクのページから利用できます。ジョンズ・ホプキンス大学の「JHU CSSE」の「Covid19 Daily Reports」のデータを利用しています。 EdgeブラウザやIEブラウザなど、Chromeブラウザ以外での利用の場合はうまく表示されないことがあるようです。↓上記のダッシュボードのデータの出所のサイトです。マップがメインのダッシュボードです-----------------------------------------------------------------------------------------↓日本のインフルエンザの「定点当たり報告数」をグラフ化できるダッシュボードを試作。都道府県別にグラフ化可能です。--------------------------------------------------------------------------★おすすめの記事 ◆How Windows Sonic looks like.:Windows Sonic for Headphonesの音声と2chステレオ音声の比較:7.1.2chテストトーンの比較で明らかになった違い:一目で違いがわかりました----------------------------------------------------------------------------------------------------------
2020.09.07
コメント(0)
-
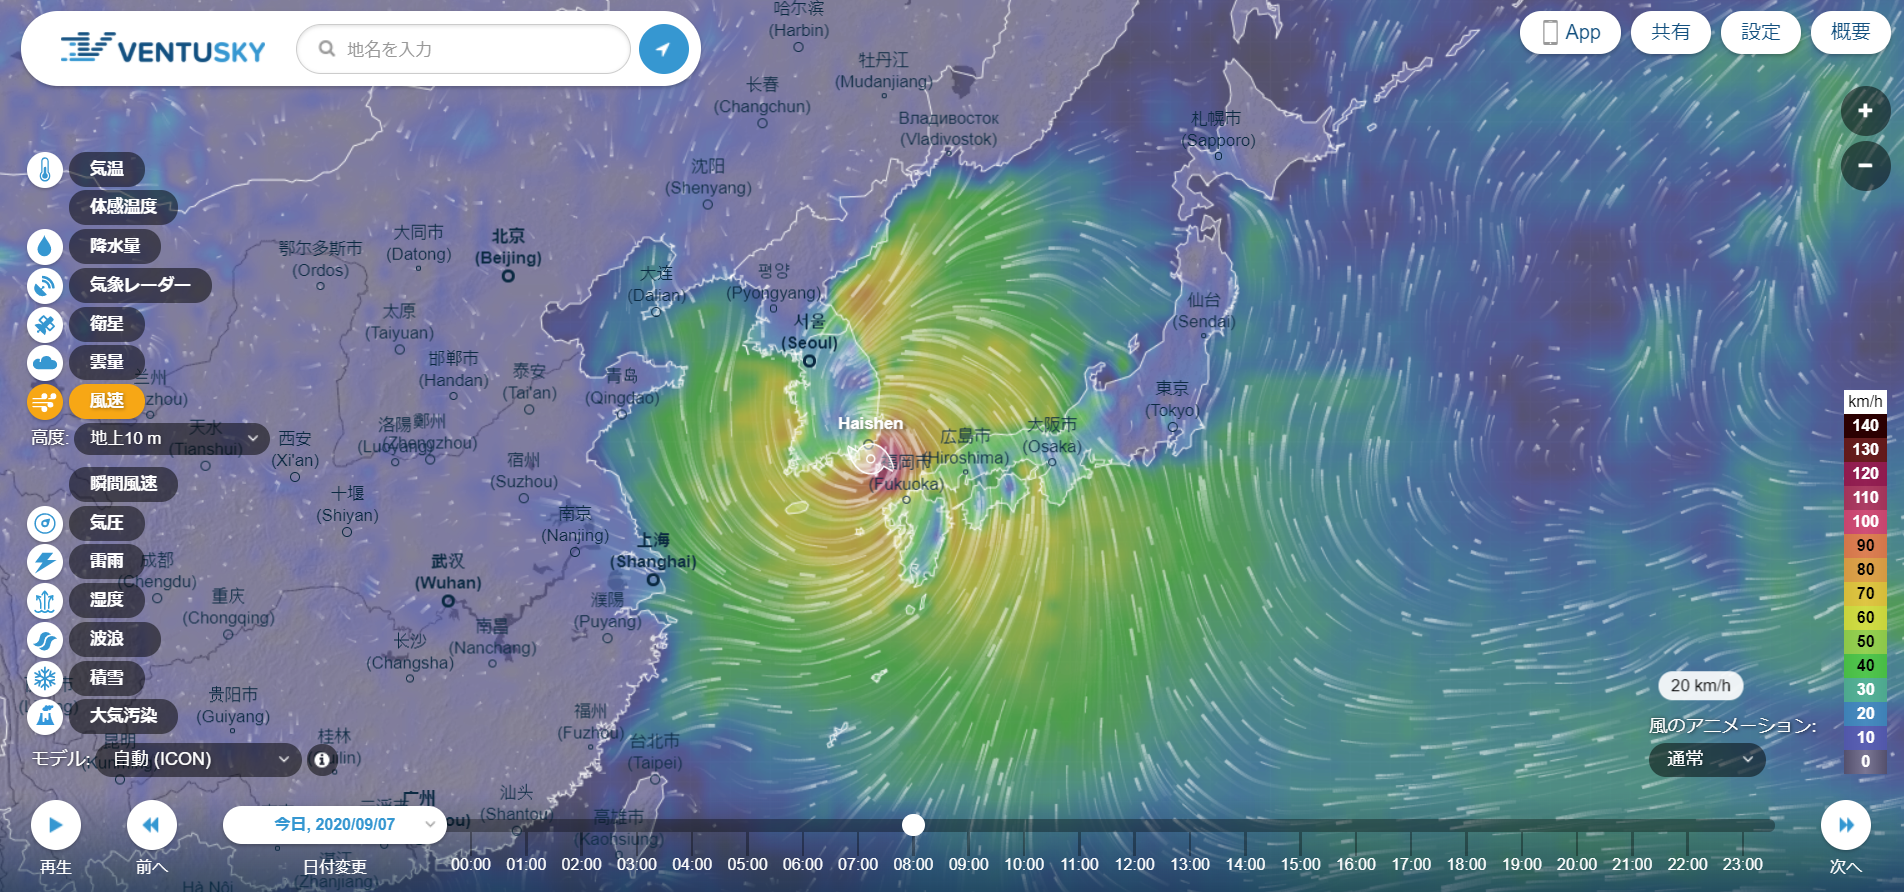
◆台風10号はどう動いたのでしょうか:Ventuskyの天気図で振り返ることができます
9月7日8時現在、台風10号は九州北西部にあるようです。上陸せずに進んだので、あまり勢力が衰えていないようです。Ventuskyの天気図から、西日本では風が強い状態が続いていることがわかります。気温、降水量、風速などの情報量、機能が豊富なVentuskyのページでは、台風10号がどのような進路で動いたのかを、日付をさかのぼって見ることができます。左下にあるメニューで日付設定ができるので、任意の日付の天気図を表示させることができ、「再生ボタン」で天気図を動かすことができます。なお、昨年の天気図も表示させることができます。----------------------------------------------------------------------楽天市場で「マスク」を検索する楽天市場で「ポビドンヨード」を検索する楽天市場で「イソジン うがい薬」を探す楽天市場で「うがい薬」を検索する楽天市場で「マウスウォッシュ・洗口液」を探す-----------------------------------------------------------------------↓うがいがそれなりに注目されているようですが、臨床研究はまだこれからのようです。↓口腔衛生に注目し、うがいの効果についてまとめられている論文です。日本の水道水によるうがいも効果がないわけではないようです。昔のカルキ臭の強い水道水の方が効果があるのでしょうか。そういえば、冷蔵庫の製氷機にはミネラルウォーターではなく、水道水を用いることが求められています。AQUOS sense3 lite+Rakuten UN-LIMITプランセット(事務手数料3300円込)【22000円相当のポイント還元】価格:31280円(税別、送料別)(2020/7/15時点)楽天で購入ついに、AQUOS sense3 liteも高額ポイントの対象になりました。マイナンバーカードの読み取りに対応している機種です。----------------------------------------------------------------------------------Galaxy A7+Rakuten UN-LIMITプランセット(事務手数料3300円込)【15000円相当のポイント還元】価格:22000円(税込、送料無料) (2020/5/31時点)楽天で購入↑楽天市場店で購入すればよかったと思います:アマゾン・プライム・ビデオはHD 1080Pで視聴できます:有機ELなので、黒がきれいです:ヘッドホンでのドルビーアトモスに対応しています。-------------------------------------------------------------------------↓楽天市場以外の有名ストアの利用でも楽天ポイントが貯まります。----------------------------------------------------------------------------------------------------------------------------------------------------------------------------------------------------------------【ダッシュボード「COVID-19 Transition Graphs」を試作】こちらは、ジョンズ・ホプキンス大学のデータを利用したダッシュボードです。中国本土以外の地域への感染が拡大しているため、国別、地域別の感染者数の推移を簡単に確認できるダッシュボードを試作しています。随時、ページを追加しています。グラフのデータは、右上部分の操作でダウンロードすることができます。アメリカの「地域別の変数」を前処理して、「州別」での推移をグラフ化できるようにしました。また、州コードのフィールドを作成してコロプレス地図も作成しています。楽天ブログでは「iframe」タグが使えないので、Bloggerのページから利用できるようにしています。無料で利用できる、グーグルの「データポータル」のダッシュボードです。データさえあれば、簡単に作成できます。「国」別、「地域」別に日ごとの感染者数の推移を見ることができます。↓ダッシュボードの試作です。下記リンクのページから利用できます。ジョンズ・ホプキンス大学の「JHU CSSE」の「Covid19 Daily Reports」のデータを利用しています。 EdgeブラウザやIEブラウザなど、Chromeブラウザ以外での利用の場合はうまく表示されないことがあるようです。↓上記のダッシュボードのデータの出所のサイトです。マップがメインのダッシュボードです-----------------------------------------------------------------------------------------↓日本のインフルエンザの「定点当たり報告数」をグラフ化できるダッシュボードを試作。都道府県別にグラフ化可能です。--------------------------------------------------------------------------★おすすめの記事 ◆How Windows Sonic looks like.:Windows Sonic for Headphonesの音声と2chステレオ音声の比較:7.1.2chテストトーンの比較で明らかになった違い:一目で違いがわかりました----------------------------------------------------------------------------------------------------------
2020.09.07
コメント(0)
-
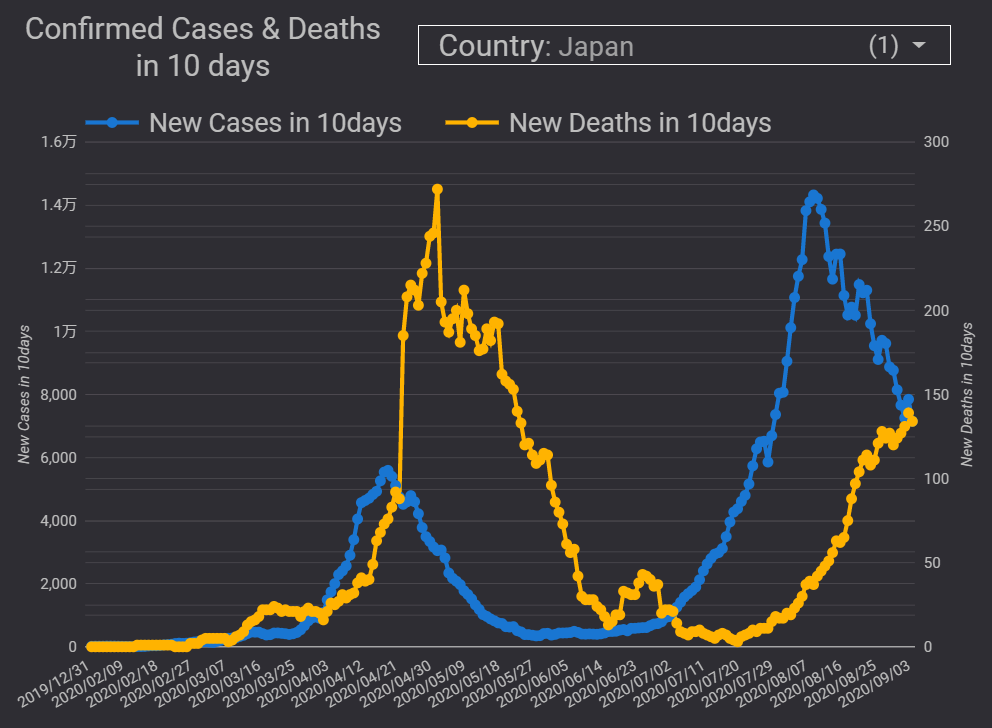
◆【新型コロナ】死亡者数は増加していますが、どの程度恐れる必要があるのでしょうか
感染確認者数は減少傾向にあることは間違いなさそうですが、感染からのタイムラグがある死亡者数はまだ減少には至っていないようです。「正しく恐れましょう」などと、「正しい」ものが何かを提示することなく、非常にあいまいで、無意味なことを言う人がいたりしますが、現在の状況はどの程度恐れるべきなのでしょうか。新形コロナの1日あたりの死亡者数は、2005年頃の交通事故による死亡者数よりも少ないのですが、飲食店の時短営業をするような状況なのでしょうか。現状では、インフルエンザによる死亡者数と大きな違いはなさそうですが、「正しい恐れ方」とは、いったいどのようなものなのでしょうか。この秋冬が終わる頃には、リスク評価もできるようになるのかもしれませんが。↓ECDCのデータを利用したダッシュボードから。10日間の感染確認者数計(左目盛り)と10日間の死亡者数計(右目盛り)の推移です。死亡者数の10日間の合計が、最近約140人となっていますが、これは1日あたり約14人の死亡者数ということになります。月間では約430人くらいになりますが、2005年頃の、交通事故による月間死亡者数より少なかったりします。----------------------------------------------------------------------楽天市場で「マスク」を検索する楽天市場で「ポビドンヨード」を検索する楽天市場で「イソジン うがい薬」を探す楽天市場で「うがい薬」を検索する楽天市場で「マウスウォッシュ・洗口液」を探す-----------------------------------------------------------------------↓うがいがそれなりに注目されているようですが、臨床研究はまだこれからのようです。↓口腔衛生に注目し、うがいの効果についてまとめられている論文です。日本の水道水によるうがいも効果がないわけではないようです。昔のカルキ臭の強い水道水の方が効果があるのでしょうか。そういえば、冷蔵庫の製氷機にはミネラルウォーターではなく、水道水を用いることが求められています。AQUOS sense3 lite+Rakuten UN-LIMITプランセット(事務手数料3300円込)【22000円相当のポイント還元】価格:31280円(税別、送料別)(2020/7/15時点)楽天で購入ついに、AQUOS sense3 liteも高額ポイントの対象になりました。マイナンバーカードの読み取りに対応している機種です。----------------------------------------------------------------------------------Galaxy A7+Rakuten UN-LIMITプランセット(事務手数料3300円込)【15000円相当のポイント還元】価格:22000円(税込、送料無料) (2020/5/31時点)楽天で購入↑楽天市場店で購入すればよかったと思います:アマゾン・プライム・ビデオはHD 1080Pで視聴できます:有機ELなので、黒がきれいです:ヘッドホンでのドルビーアトモスに対応しています。-------------------------------------------------------------------------↓楽天市場以外の有名ストアの利用でも楽天ポイントが貯まります。----------------------------------------------------------------------------------------------------------------------------------------------------------------------------------------------------------------【ダッシュボード「COVID-19 Transition Graphs」を試作】こちらは、ジョンズ・ホプキンス大学のデータを利用したダッシュボードです。中国本土以外の地域への感染が拡大しているため、国別、地域別の感染者数の推移を簡単に確認できるダッシュボードを試作しています。随時、ページを追加しています。グラフのデータは、右上部分の操作でダウンロードすることができます。アメリカの「地域別の変数」を前処理して、「州別」での推移をグラフ化できるようにしました。また、州コードのフィールドを作成してコロプレス地図も作成しています。楽天ブログでは「iframe」タグが使えないので、Bloggerのページから利用できるようにしています。無料で利用できる、グーグルの「データポータル」のダッシュボードです。データさえあれば、簡単に作成できます。「国」別、「地域」別に日ごとの感染者数の推移を見ることができます。↓ダッシュボードの試作です。下記リンクのページから利用できます。ジョンズ・ホプキンス大学の「JHU CSSE」の「Covid19 Daily Reports」のデータを利用しています。 EdgeブラウザやIEブラウザなど、Chromeブラウザ以外での利用の場合はうまく表示されないことがあるようです。↓上記のダッシュボードのデータの出所のサイトです。マップがメインのダッシュボードです-----------------------------------------------------------------------------------------↓日本のインフルエンザの「定点当たり報告数」をグラフ化できるダッシュボードを試作。都道府県別にグラフ化可能です。--------------------------------------------------------------------------★おすすめの記事 ◆How Windows Sonic looks like.:Windows Sonic for Headphonesの音声と2chステレオ音声の比較:7.1.2chテストトーンの比較で明らかになった違い:一目で違いがわかりました----------------------------------------------------------------------------------------------------------
2020.09.05
コメント(0)
-

◆【新型コロナ】スプートニクV(Sputnik V)のデータが公開されました:ロシアのアデノウイルスベクターワクチン
第3相臨床試験を経ずに、ロシアで承認されたワクチン「スプートニクV」。承認された時点で、データが非公開でしたが、その第1/2相臨床試験の結果が「ランセット誌」で公開されました。ワクチン開発は、ある意味で、軍事技術の側面もあるでしょうから、ロシアのワクチンもそれなりに優れているのかもしれません。なお、「スプートニクV」は、アデノウイルスベクターワクチンで、アデノウイルスに新型コロナウイルスの遺伝子を組み込んで免疫反応を誘発する仕組みだそうです。↓「ランセット誌」で発表された第1/2相臨床試験の結果です。有効性と安全性が確認されているようです。----------------------------------------------------------------------楽天市場で「マスク」を検索する楽天市場で「ポビドンヨード」を検索する楽天市場で「イソジン うがい薬」を探す楽天市場で「うがい薬」を検索する楽天市場で「マウスウォッシュ・洗口液」を探す-----------------------------------------------------------------------楽天市場で「フコイダン」を探す-----------------------------------------------------------------------↓うがいがそれなりに注目されているようですが、臨床研究はまだこれからのようです。↓口腔衛生に注目し、うがいの効果についてまとめられている論文です。日本の水道水によるうがいも効果がないわけではないようです。昔のカルキ臭の強い水道水の方が効果があるのでしょうか。そういえば、冷蔵庫の製氷機にはミネラルウォーターではなく、水道水を用いることが求められています。AQUOS sense3 lite+Rakuten UN-LIMITプランセット(事務手数料3300円込)【22000円相当のポイント還元】価格:31280円(税別、送料別)(2020/7/15時点)楽天で購入ついに、AQUOS sense3 liteも高額ポイントの対象になりました。マイナンバーカードの読み取りに対応している機種です。----------------------------------------------------------------------------------Galaxy A7+Rakuten UN-LIMITプランセット(事務手数料3300円込)【15000円相当のポイント還元】価格:22000円(税込、送料無料) (2020/5/31時点)楽天で購入↑楽天市場店で購入すればよかったと思います:アマゾン・プライム・ビデオはHD 1080Pで視聴できます:有機ELなので、黒がきれいです:ヘッドホンでのドルビーアトモスに対応しています。-------------------------------------------------------------------------↓楽天市場以外の有名ストアの利用でも楽天ポイントが貯まります。----------------------------------------------------------------------------------------------------------------------------------------------------------------------------------------------------------------【ダッシュボード「COVID-19 Transition Graphs」を試作】こちらは、ジョンズ・ホプキンス大学のデータを利用したダッシュボードです。中国本土以外の地域への感染が拡大しているため、国別、地域別の感染者数の推移を簡単に確認できるダッシュボードを試作しています。随時、ページを追加しています。グラフのデータは、右上部分の操作でダウンロードすることができます。アメリカの「地域別の変数」を前処理して、「州別」での推移をグラフ化できるようにしました。また、州コードのフィールドを作成してコロプレス地図も作成しています。楽天ブログでは「iframe」タグが使えないので、Bloggerのページから利用できるようにしています。無料で利用できる、グーグルの「データポータル」のダッシュボードです。データさえあれば、簡単に作成できます。「国」別、「地域」別に日ごとの感染者数の推移を見ることができます。↓ダッシュボードの試作です。下記リンクのページから利用できます。ジョンズ・ホプキンス大学の「JHU CSSE」の「Covid19 Daily Reports」のデータを利用しています。 EdgeブラウザやIEブラウザなど、Chromeブラウザ以外での利用の場合はうまく表示されないことがあるようです。↓上記のダッシュボードのデータの出所のサイトです。マップがメインのダッシュボードです-----------------------------------------------------------------------------------------↓日本のインフルエンザの「定点当たり報告数」をグラフ化できるダッシュボードを試作。都道府県別にグラフ化可能です。--------------------------------------------------------------------------★おすすめの記事 ◆How Windows Sonic looks like.:Windows Sonic for Headphonesの音声と2chステレオ音声の比較:7.1.2chテストトーンの比較で明らかになった違い:一目で違いがわかりました----------------------------------------------------------------------------------------------------------
2020.09.05
コメント(0)
全1041件 (1041件中 301-350件目)
-
-

- ブログ更新しました♪
- 楽天ブログのSEO対策の始め方|初心…
- (2024-09-25 21:00:11)
-
-
-
- 【楽天市場】新製品の激安 価格比較…
- Có nên mua máy lọc nước ion kiềm
- (2022-12-29 13:40:56)
-
-
-
- 家電よもやま
- JVC JL-43N4L 4Kチューナーレステレ…
- (2024-09-26 09:12:05)
-


