
2024年03月の記事
全41件 (41件中 1-41件目)
1
-

バリューコマース(2491)---CRM伸び悩み。新規事業投資や人件費増重い。
バリューコマース(2491.ネット広告)を見ておきます。関連日記まずは、メモ書きです。・保有銘柄。・2021年12月期の1株当たり純資産は、前期比が112.9%、3期前比が181.1%、5期前比が272.6%。・2022年12月期の1株当たり純資産は、前期比が125.6%、3期前比が181.0%、5期前比が298.4%。・2023年12月期の1株当たり純資産は、前期比が107.9%、3期前比が153.0%、5期前比が245.4%。次に、経常利益を見てみる。2019年(令和01年)12月期 4,9882020年(令和02年)12月期 6,2712021年(令和03年)12月期 7,9472022年(令和04年)12月期 8,3192023年(令和05年)12月期 5,217次に、1株配・配当金総額・配当性向・純資産配当率を見てみる。2020年12月期 41.0円・1,324百万円・31.0%・10.1%2021年12月期 43.0円・1,389百万円・42.6%・8.9%2022年12月期 56.0円・1,810百万円・31.2%・9.7%2023年12月期 53.0円・1,713百万円・50.4%・7.9%2024年12月期 42.0円次に、四季報で株主数・外人比率・特定株比率を見てみる。・2,604名<21.12>・25.2%・77.7%・3,075名<22.6>・22.1%・79.2%・5,202名<22.12>・18.8%・75.0%・6,656名<23.6>・20.0%・73.6%・6,725名<23.12>・17.5%・73.9%次に、四季報で時価総額・現金等・有利子負債を見てみる。2022年06月発売号 1,108億円・154億円・0億円2022年12月発売号 722億円・154億円・0億円2023年03月発売号 577億円・201億円・0億円2023年09月発売号 434億円・201億円・0億円2024年03月発売号 391億円・215億円・0億円次に、自己資本比率・1株当たり純資産・のれん・営業CFを見てみる。2016年12月期 61.3%・188.02円・647,591千円・1,003 2017年12月期 59.5%・215.73円・337,043千円・2,2052018年12月期 62.1%・283.02円・224,695千円・2,7562019年12月期 63.8%・355.60円・1,321,103千円・4,0412020年12月期 65.3%・454.13円・698百万円・5,8942021年12月期 69.2%・512.53円・156百万円・5,3972022年12月期 73.8%・643.78円・104百万円・6,7742023年12月期 79.2%・694.67円・52百万円・3,499次に、期末発行済株式数(自己株式を含む)・期末自己株式数を見てみる。2016年12月期末 34,471,000・1,930,7002017年12月期末 34,471,000・2,275,6002018年12月期末 34,471,000・2,185,7002019年12月期末 34,471,000・2,170,7792020年12月期末 34,471,000・2,165,6552021年12月期末 34,471,000・2,155,5032022年12月期末 34,471,000・2,133,6992023年12月期末 34,471,000・2,133,238次に、株価と指標等を見てみる。3月22日の終値は、1,107円予想PERは、13.26倍実績PBRは、1.59倍予想利回りは、3.79%GMOクリック証券によると、・理論株価は、2,319円。(事業価値1,653円+財産価値666円-有利子負債0円)・理論株価比は、47.7%。(現在値÷理論株価)最後に、四季報3月号の記事を見てみる。【決算】12月【設立】1999.9【上場】2006.7【特色】アフィリエイト(成果報酬型)広告で首位級。ヤフー出店者向けにクリック課金広告、CRM展開【連結事業】マーケティングソリューション40(16)、ECソリューション60(27) <23・12>【減益続く】クリック課金広告はキーワード検索などサービス追加、単価向上で復調。ただ金融の一部顧客で出稿失速、成果報酬型広告後退。CRM伸び悩み。新規事業投資や人件費増重い。営業益続落。減配。【中計見直し】新規事業投資への舵切りで利益目標撤回。今後3年は年平均3%の売上成長目指す。AIとデータ活用しホテルの運営改善など観光業向けサービス模索。
2024/03/31
コメント(0)
-

征野ファンドの運用状況---2024年3月末時点で、昨年末比+15.89%
3月29日時点の征野ファンドの運用状況です。昨年末比は、■征野ファンド・・・・+15.89%。■トピックスは・・・・+17.00%。で、トピックスを下回る成績になっています。(トピックスの終値は、2768.62)組入上位5銘柄は、1.信越化学工業(4063)2.光通信(9435)3.伊藤忠商事(8001)4.iSTOPIX(1475)5.トヨタ自動車(7203)で、前週末と比べると、順位の変動はありますが、銘柄は同じです。売買の詳細は、こちら。
2024/03/30
コメント(2)
-

毎日コムネット(8908)を全株売付
今週(3/25~3/29)の売買は、5834 SBIリーシング 買い増し。6197 ソラスト 買い増し。7163 住信SBIネット銀行 買い増し。8473 SBIHD 買い増し。6197 ソラスト 一部売り。8908 毎日コムネット 全株売付。
2024/03/30
コメント(0)
-

INPEX(1605)---IFRS移行。油価下落。国内ガス生産量減。
INPEX(1605.原油・天然ガス開発)を見ておきます。関連日記まずは、メモ書きです。・買付候補銘柄。・2022年12月期の1株当たり純資産は、前期比が128.3%、3期前比が138.9%、5期前比が144.8%。・2023年12月期の1株当たり純資産は、前期比が113.8%、3期前比が175.5%、5期前比が159.8%。次に、経常利益を見てみる。2019年(平成31年)03月期 519,2782019年(令和01年)12月期 511,0882020年(令和02年)12月期 257,3352021年(令和03年)12月期 657,6272022年(令和04年)12月期 1,441,9952023年(令和05年)12月期 1,350,448次に、1株配・配当金総額・配当性向・純資産配当率を見てみる。2021年12月期 48.0円・68,033百万円・31.2%・2.1%2022年12月期 62.0円・83,420百万円・19.3%・2.1%2023年12月期 74.0円・94,943百万円・25.8%・2.4%2024年12月期 76.0円次に、四季報で株主数・外人比率・特定株比率を見てみる。・195,397名<23.6>・28.6%・57.0%・227,410名<23.12>・25.4%・59.5%次に、四季報で時価総額・現金等・有利子負債を見てみる。2023年09月発売号 28,267億円・2,116億円・12,821億円2023年12月発売号 28,981億円・2,116億円・13,256億円2024年03月発売号 24,981億円・2,008億円・10,569億円次に、自己資本比率・1株当たり純資産・のれん・営業CFを見てみる。2018年3月期 68.6%・1,997.24円・54,037百万円・278,5392019年3月期 62.7%・2,058.95円・47,276百万円・238,5662019年12月期 62.7%・2,082.43円・42,206百万円・274,7302020年12月期 59.0%・1,874.08円・35,445百万円・292,9152021年12月期 60.6%・2,253.17円・29,550百万円・445,4572022年12月期 60.3%・2,891.93円・40,332百万円・751,2842023年12月期 63.5%・3,289.78円・32,020百万円・786,324次に、期末発行済株式数(自己株式を含む)・期末自己株式数を見てみる。2018年3月期末 1,462,323,600・1,966,5002019年3月期末 1,462,323,600・2,123,8002019年12月期末 1,462,323,600・2,121,9162020年12月期末 1,462,323,600・2,119,0692021年12月期末 1,462,323,600・75,805,9932022年12月期末 1,386,667,167・80,672,8632023年12月期末 1,386,667,167・128,422,706次に、株価と指標等を見てみる。3月22日の終値は、2,284円予想PERは、8.71倍実績PBRは、0.69倍予想利回りは、3.33%GMOクリック証券によると、・理論株価は、8,833円。(事業価値8,892円+財産価値1,122円-有利子負債1,182円)・理論株価比は、25.9%。(現在値÷理論株価)最後に、四季報3月号の記事を見てみる。【決算】12月【設立】2006.4【上場】2006.4【特色】原油・ガス開発生産国内最大手。政府が黄金株保有。豪州でLNG案件(イクシス)を操業【連結事業】原油75、天然ガス24、他1【海外】64 <23・12>【連続増配】IFRS移行。油価下落。国内ガス生産量減。海外は中東や東南アジアで権益一部売却。探鉱費等イクシス関連費用かさんでも豪州洋上LNG減損なく、プロジェクト整理で税金軽減。純益は高水準。【拡 大】東京ガス保有イクシス権益追加取得で権益比率67・82%に拡大。23年12月インドネシアLNGプロジェクトで改定開発計画承認されCO2貯留事業が本格始動。
2024/03/29
コメント(2)
-

フジ・コーポレーション(7605)---タイヤ・ホイール販売は前期値上げ前の駆け込み需要の反動少なく、上期数量は増加。
フジ・コーポレーション(7605.自動車用品小売り)を見ておきます。関連日記 まずは、メモ書きです。・保有銘柄。・30年10月期の1株当たり純資産は、前期比が113.5%、3期前比が150.5%、5期前比が214.2%。・2019年10月期の1株当たり純資産は、前期比が116.2%、3期前比が145.8%、5期前比が210.0%。・2020年10月期の1株当たり純資産は、前期比が112.3%、3期前比が147.9%、5期前比が196.3%。・2021年10月期の1株当たり純資産は、前期比が113.8%、3期前比が148.4%、5期前比が186.2%。・2022年10月期の1株当たり純資産は、前期比が115.7%、3期前比が147.7%、5期前比が194.7%。・2023年10月期の1株当たり純資産は、前期比が112.6%、3期前比が148.2%、5期前比が193.2%。次に、経常利益を見てみる。2016年(平成28年)10月期 2,2592017年(平成29年)10月期 2,3422018年(平成30年)10月期 2,8652019年(令和01年)10月期 3,7602020年(令和02年)10月期 3,5302021年(令和03年)10月期 4,2142022年(令和04年)10月期 5,3792023年(令和05年)10月期 5,770次に、1株配・配当金総額・配当性向・純資産配当率を見てみる。29年10月期 17.5円・357百万円・24.3%・3.1%30年10月期 17.5円・357百万円・18.0%・2.8%2019年10月期 20.0円・408百万円・15.9%・2.8%2020年10月期 20.0円・408百万円・17.3%・2.4%2021年10月期 22.5円・460百万円・16.1%・2.4%2022年10月期 25.0円・488百万円・13.6%・2.3%2023年10月期 30.0円・575百万円・14.6%・2.5%2024年10月期 40.0円次に、四季報で株主数・外人比率・特定株比率を見てみる。・9,245名<18.10>・16.7%・70.7%・10,764名<19.10>・14.5%・70.5%・13,761名<20.4>・12.1%・69.7%・14,166名<21.10>・12.1%・72.6%・7,798名<22.10>・13.0%・72.2%・5,363名<23.10>・12.8%・74.5%次に、四季報で時価総額・現金等・有利子負債を見てみる。2019年03月発売号 225億円・26億円・39億円2020年03月発売号 205億円・15億円・35億円2021年09月発売号 244億円・25億円・0億円2022年03月発売号 248億円・23億円・0億円2023年03月発売号 248億円・8億円・0億円2024年03月発売号 351億円・19億円・0億円次に、自己資本比率・1株当たり純資産・のれん・営業CFを見てみる。25年10月期 44.3%・626.63円・0円・19826年10月期 45.8%・742.74円・0円・1,35127年10月期 39.0%・891.78円・0円・1,33828年10月期 51.8%・1,069.39円・0円・2,68629年10月期 56.1%・1,183.25円・0円・1,23730年10月期 57.8%・1,342.50円・0円・3,5912019年10月期 63.8%・1,559.41円・0円・1,1982020年10月期 62.2%・1,750.60円・0円・5,0782021年10月期 69.4%・995.81円・0円・4,3132022年10月期 71.3%・1,151.77円・0円・1,3082023年10月期 72.6%・1,296.89円・0円・4,635次に、期末発行済株式数(自己株式を含む)・期末自己株式数を見てみる。25年10月期末 9,680,000・276,08626年10月期末 9,680,000・276,13427年10月期末 9,680,000・276,288 28年10月期末 10,485,000・276,28829年10月期末 10,485,000・276,28830年10月期末 10,485,000・276,3612019年10月期末 10,485,000・276,4312020年10月期末 10,485,000・268,6332021年10月期末 20,970,000・500,166(分1→2)2022年10月期末 19,970,000・441,6102023年10月期末 19,223,900・358,436次に、株価と指標等を見てみる。3月22日の終値は、1,774円予想PERは、8.27倍実績PBRは、1.37倍予想利回りは、2.25%GMOクリック証券によると、・理論株価は、1,955円。(事業価値1,941円+財産価値56円-有利子負債42円)・理論株価比は、90.7%。(現在値÷理論株価)最後に、四季報3月号の記事を見てみる。【決算】10月【設立】1982.11【上場】1999.6【特色】タイヤの専売店『タイヤ&ホイール館フジ』を東北、関東中心に直営展開。通販も手がける【単独事業】タイヤ・ホイール86、用品7、作業料6 <23・10>【連続最高益】タイヤ・ホイール販売は前期値上げ前の駆け込み需要の反動少なく、上期数量は増加。下期数量横ばいでも前期値上げ効果で補う。光熱費高や部品代高騰こなし営業増益。連続最高純益。増配。【導 入】2月譲渡制限付株式報酬を導入。自己株式を処分し取締役に割り当て。配当など株主還元も強化へ。ネット通販はAI活用などで顧客対応の省人化を図る。
2024/03/28
コメント(2)
-

グッドコムアセット(3475)---投資用マンション販売はずれ込み分含めて2400戸(前期715戸)想定。
グッドコムアセット(3475.投資用マンション分譲)を見ておきます。関連日記まずは、メモ書きです。・買付候補銘柄。・2022年10月期の1株当たり純資産は、前期比が124.3%、3期前比が163.7%、5期前比が299.0%。・2023年10月期の1株当たり純資産は、前期比が101.0%、3期前比が141.7%、5期前比が184.8%。次に、経常利益を見てみる。2017年(平成29年)10月期 8202018年(平成30年)10月期 1,5672019年(令和01年)10月期 1,6502020年(令和02年)10月期 2,6442021年(令和03年)10月期 3,1642022年(令和04年)10月期 4,3422023年(令和05年)10月期 1,788次に、1株配・配当金総額・配当性向・純資産配当率を見てみる。2021年10月期 21.5円・616百万円・31.8%・7.0%2022年10月期 30.0円・862百万円・30.1%・8.3%2023年10月期 35.0円・1,007百万円・97.8%・8.7%2024年10月期 36.0円次に、四季報で株主数・外人比率・特定株比率を見てみる。・10,658名<22.4>・4.5%・63.3%・11,183名<23.4>・6.6%・63.8%・12,350名<23.10>・3.5%・64.0%次に、四季報で時価総額・現金等・有利子負債を見てみる。2022年09月発売号 201億円・79億円・75億円2023年09月発売号 287億円・116億円・217億円2024年03月発売号 229億円・80億円・403億円次に、自己資本比率・1株当たり純資産・のれん・営業CFを見てみる。2017年10月期 25.7%・533.93円・0円・△5,501 2018年10月期 51.1%・872.55円・0円・5,1652019年10月期 46.2%・487.68円・0円・△2,642 2020年10月期 32.4%・569.19円・539,942千円・△6,1122021年10月期 45.0%・321.21円・249,805千円・9,7002022年10月期 46.9%・399.13円・105,750千円・3,4822023年10月期 21.7%・403.17円・0円・△33,170次に、期末発行済株式数(自己株式を含む)・期末自己株式数を見てみる。2017年10月期末 6,071,200・2202018年10月期末 7,285,400・2202019年10月期末 14,690,000・300,512(分1→2)2020年10月期末 15,198,000・444,4262021年10月期末 30,458,400・1,788,852(分1→2)2022年10月期末 30,498,400・1,756,2382023年10月期末 30,530,400・1,737,513次に、株価と指標等を見てみる。3月19日の終値は、756円予想PERは、6.7倍実績PBRは、1.88倍予想利回りは、4.76%GMOクリック証券によると、・理論株価は、644円。(事業価値1,782円+財産価値264円-有利子負債1,402円)・理論株価比は、117.4%。(現在値÷理論株価)最後に、四季報3月号の記事を見てみる。【決算】10月【設立】2006.5【上場】2016.12【特色】東京23区で投資用マンションを販売。不動産運用会社向け1棟売り中心に個人投資家にも販売【連結事業】ホールセール39(14)、リテールセールス52(-5)、リアルエステートマネジメント8(23)、他0(-495) <23・10>【回 帰】投資用マンション販売はずれ込み分含めて2400戸(前期715戸)想定。引き渡しの出足鈍いが、運用会社や同業他社など法人向けが大幅増。自社ファンド向けも後半設定。利益成長軌道に回帰。【期ずれ】私募ファンドの組成遅れで、23棟・1190戸がずれ込み。ファンドは規模圧縮し100億円程度で始動。エリア拡大もあり前期仕入れは3400戸に増加。
2024/03/27
コメント(0)
-

神戸物産(3038)---円安なお痛いが、値上げ効果やPB伸長が寄与。
神戸物産(3038.食品卸)を見ておきます。関連日記 まずは、メモ書きです。・買付候補銘柄。・2019年10月期の1株当たり純資産は、前期比が130.7%、3期前比が260.1%、5期前比が242.5%。・2020年10月期の1株当たり純資産は、前期比が129.8%、3期前比が235.3%、5期前比が374.2%。・2021年10月期の1株当たり純資産は、前期比が131.1%、3期前比が222.3%、5期前比が442.6%。・2022年10月期の1株当たり純資産は、前期比が123.7%、3期前比が210.4%、5期前比が381.5%。・2023年10月期の1株当たり純資産は、前期比が116.8%、3期前比が189.3%、5期前比が321.1%。次に、経常利益を見てみる。2016年(平成28年)10月期 8,7292017年(平成29年)10月期 15,7782018年(平成30年)10月期 15,8312019年(令和01年)10月期 19,4342020年(令和02年)10月期 23,6462021年(令和03年)10月期 29,0872022年(令和04年)10月期 32,1252023年(令和05年)10月期 29,970次に、1株配・配当金総額・配当性向・純資産配当率を見てみる。2018年10月期 8.13円・1,734百万円・16.6%・8.4%2019年10月期 10.0円・2,150百万円・17.8%・11.0%2020年10月期 15.0円・3,242百万円・21.5%・12.7%2021年10月期 20.0円・4,363百万円・22.1%・6.5%2022年10月期 22.0円・4,824百万円・23.1%・5.6%2023年10月期 22.0円・4,859百万円・23.5%・4.7%2024年10月期 23.0円次に、四季報で株主数・外人比率・特定株比率を見てみる。・22,196名<19.10>・11.0%・65.7%・25,825名<20.4>・15.8%・65.3%・63,090名<21.10>・16.3%・64.1%・72,183名<22.10>・15.2%・64.0%・61,344名<23.10>・17.8%・65.3%次に、四季報で時価総額・現金等・有利子負債を見てみる。2020年06月発売号 8,604億円・697億円・647億円2021年09月発売号 11,299億円・682億円・411億円2022年03月発売号 10,355億円・567億円・346億円2023年03月発売号 10,000億円・657億円・345億円2023年03月発売号 10,766億円・912億円・383億円次に、自己資本比率・1株当たり純資産・のれん・営業CFを見てみる。26年10月期 17.7%・679.61円・0円・8,65627年10月期 11.1%・571.64円・0円・6,89628年10月期 12.4%・633.50円・0円・11,96229年10月期 16.6%・909.14円・0円・13,6612018年10月期 23.3%・315.34円・783百万円・13,6932019年10月期 29.5%・412.01円・1,282百万円・19,2172020年10月期 39.0%・267.42円・22百万円・19,5432021年10月期 48.8%・350.49円・17百万円・21,2612022年10月期 52.7%・433.53円・12百万円・21,5822023年10月期 52.7%・506.23円・7百万円・30,343 次に、期末発行済株式数(自己株式を含む)・期末自己株式数を見てみる。26年10月期末 35,200,000・7,015,31227年10月期末 34,200,000・8,064,82828年10月期末 34,200,000・8,059,68629年10月期末 34,200,000・7,801,7372018年10月期末 136,800,000・30,178,232(分1→4)2019年10月期末 136,800,000・29,344,6322020年10月期末 273,600,000・57,614,064(分1→2)2021年10月期末 273,600,000・55,587,3202022年10月期末 273,600,000・54,490,5202023年10月期末 273,600,000・52,968,055次に、株価と指標等を見てみる。3月19日の終値は、3,689円予想PERは、37倍実績PBRは、7.29倍予想利回りは、0.62%GMOクリック証券によると、・理論株価は、1,205円。(事業価値1,009円+財産価値382円-有利子負債185円)・理論株価比は、306.1%。(現在値÷理論株価)最後に、四季報3月号の記事を見てみる。【決算】10月【設立】1991.4【上場】2006.6【特色】冷凍品など食材販売の『業務スーパー』をFC展開。総菜店併設で中食も強化。輸入材料多い【連結事業】業務スーパー97(8)、外食・中食2(5)、エコ再生エネルギー1(26)、他0(-133) <23・10>【最高益】業務スーパーはFC純増35(前期41)。既存店は冷凍野菜など定番品が滑り出し好調。円安なお痛いが、値上げ効果やPB伸長が寄与。会社計画慎重、営業益増勢。営業外のデリバティブ損減。増配。【中 計】26年10月期の売上高5430億円、営業益370億円目標。大型工場は4月稼働の宮城に続き、26年度中に千葉で計画。生産能力を引き上げ出店拡大に備え。
2024/03/26
コメント(4)
-

デイトナ(7228)---海外子会社は販路拡大進み好調。だが国内卸がバイクブーム一服に伴う顧客の在庫調整で後退。
デイトナ(7228.2輪車部品)を見ておきます。まずは、メモ書きです。・買付候補銘柄。・2023年12月期の1株当たり純資産は、前期比が113.4%、3期前比が180.3%、5期前比が251.1%。次に、経常利益を見てみる。2020年(令和02年)12月期 1,1992021年(令和03年)12月期 1,8882022年(令和04年)12月期 2,1162023年(令和05年)12月期 1,749次に、1株配・配当金総額・配当性向・純資産配当率を見てみる。2022年12月期 123円・290百万円・20.2%・4.8%2023年12月期 121円・286百万円・24.2%・4.0%2024年12月期 129円次に、四季報で株主数・外人比率・特定株比率を見てみる。・2,845名<23.6>・2.6%・63.6%次に、四季報で時価総額・現金等・有利子負債を見てみる。2023年12月発売号 114億円・9億円・16億円次に、自己資本比率・1株当たり純資産・のれん・営業CFを見てみる。2018年12月期 45.7%・1,271.41円・585,484千円・4542019年12月期 50.3%・1,450.23円・520,430千円・5162020年12月期 57.0%・1,771.02円・455,376千円・1,4832021年12月期 65.7%・2,289.75円・390,322千円・7522022年12月期 69.0%・2,814.56円・325,269千円・△4 2023年12月期 73.2%・3,193.10円・260,215千円・1,224次に、期末発行済株式数(自己株式を含む)・期末自己株式数を見てみる。2018年12月期末 3,604,600・1,260,5972019年12月期末 3,604,600・1,260,6722020年12月期末 3,604,600・1,260,6722021年12月期末 3,604,600・1,260,7312022年12月期末 3,604,600・1,241,9602023年12月期末 3,604,600・1,235,970次に、株価と指標等を見てみる。3月15日の終値は、3,210円予想PERは、6.28倍実績PBRは、1.01倍予想利回りは、4.02%GMOクリック証券によると、・理論株価は、6,782円。(事業価値6,720円+財産価値661円-有利子負債599円)・理論株価比は、47.3%。(現在値÷理論株価)最後に、四季報12月号の記事を見てみる。【決算】12月【設立】1972.4【上場】1997.10【特色】2輪車部品・用品の企画、卸売りを手がける。小売店も5店展開。インドネシアに進出。独立系【連結事業】国内拠点卸売76(15)、アジア拠点卸売4(17)、小売18(8)、他2(10)【海外】13 <22・12>【上向く】海外子会社は販路拡大進み好調。だが国内卸がバイクブーム一服に伴う顧客の在庫調整で後退。営業益反落。減配。24年12月期は国内の小売りは横ばいやっとでも、卸が在庫調整一巡で持ち直す。新商品投入も寄与する。海外伸長続いて反発。【新規参入】電動キックボードを24年初頭販売開始。電動アシスト自転車ノウハウ活用。渥美半島観光協会とパートナー協定。
2024/03/25
コメント(2)
-

2011年4月5日発行のトリニダード・トバゴの切手には、エリック・ウィリアムズが描かれている。
画像は、2011年4月5日発行の、トリニダード・トバゴの切手。描かれている人物は、エリック・ウィリアムズ。まず、トニリダード・トバゴという国は、「カリブ海の小アンティル諸島南部に位置するトリニダード島とトバゴ島の2島と属領からなる共和制国家で、イギリス連邦加盟国である。」と、ウィキペディアに書かれています。大雑把な歴史では、・1532年 スペインの植民地となる。・1962年 英連邦王国としてイギリスから独立。という感じ。そして、この切手に描かれている人物、エリック・ウィリアムズ。どのような方かというと、ウィキペディアには、次のように書かれています。---引用開始エリック・ユースタス・ウィリアムズ(Eric Eustace Williams, TC(英語版) CH, 1911年9月25日 - 1981年3月29日)は、カリブ海にある島国トリニダード・トバゴ共和国の政治家・初代首相。国家への多大な貢献から「トリニダードの父」と呼ばれている。歴史学者としても著名。---引用終了で、今回の切手は、エリック・ウィリアムズの生誕100周年の記念切手になります。そして、この切手の額面は、15トリニダード・トバゴ・ドルで、日本円に換算すると、331.13円になります。(1TTD=22.08JPY)
2024/03/25
コメント(0)
-

マツキヨココカラ&カンパニー(3088)---25年3月期も医薬品が牽引し連続営業増益。
マツキヨココカラ&カンパニー(3088.ドラッグストア)を見ておきます。関連日記まずは、メモ書きです。・保有銘柄。・30年3月期の1株当たり純資産は、前期比が111.3%、3期前比が131.6%、5期前比が150.5%。・2020年3月期の1株当たり純資産は、前期比が109.6%、3期前比が128.4%、5期前比が151.9%。・2021年3月期の1株当たり純資産は、前期比が107.5%、3期前比が124.0%、5期前比が150.1%。・2022年3月期の1株当たり純資産は、前期比が136.8%、3期前比が161.1%、5期前比が188.9%。・2023年3月期の1株当たり純資産は、前期比が105.3%、3期前比が154.9%、5期前比が178.8%。次に、経常利益を見てみる。2014年(平成26年)3月期 24,5142015年(平成27年)3月期 20,0312016年(平成28年)3月期 29,8052017年(平成29年)3月期 30,8282018年(平成30年)3月期 36,1232019年(平成31年)3月期 38,9782020年(令和02年)3月期 39,9852021年(令和03年)3月期 34,0912022年(令和04年)3月期 44,8812023年(令和05年)3月期 66,721次に、1株配・配当金総額・配当性向・純資産配当率を見てみる。20年3月期 3.3円・980百万円・14.9%・1.1%21年3月期 5.0円・1,431百万円・18.5%・1.5%22年3月期 5.0円・1,432百万円・19.7%・1.4%23年3月期 6.7円・1,925百万円・26.4%・1.8%24年3月期 6.7円・1,857百万円・18.7%・1.7%25年3月期 8.3円・2,507百万円・22.2%・2.0%26年3月期 10.0円・3,277百万円・24.5%・2.3%27年3月期 10.0円・3,218百万円・27.7%・2.1%28年3月期 14.2円・4,558百万円・25.5%・2.8%29年3月期 15.8円・5,033百万円・25.0%・2.8%30年3月期 18.3円・5,828百万円・25.6%・3.0%2019年3月期 21.7円・6,775百万円・27.1%・3.3%2020年3月期 23.3円・7,194百万円・27.4%・3.3%2021年3月期 23.3円・7,194百万円・33.3%・3.0%2022年3月期 23.3円・8,520百万円・24.7%・2.5%2023年3月期 28.3円・11,915百万円・29.5%・2.5%2024年3月期 33.7円次に、四季報で株主数・外人比率・特定株比率を見てみる。・19,713名<18.9>・35.6%・36.1%・25,018名<19.9>・35.9%・34.1%・30,082名<20.9>・34.8%・37.4%・19,291名<21.3>・37.1%・36.7%・26,595名<22.3>・35.4%・38.0%・22,749名<23.3>・34.9%・37.3%・27,492名<23.9>・35.6%・35.0%次に、四季報で時価総額・現金等・有利子負債を見てみる。2013年09月発売号 1,854億円・115億円・25億円2014年09月発売号 1,835億円・181億円・30億円2018年12月発売号 4,726億円・516億円・0億円2020年03月発売号 3,857億円・433億円・0億円2020年12月発売号 5,485億円・283億円・184億円2021年06月発売号 5,163億円・385億円・184億円2022年06月発売号 7,191億円・745億円・192億円2023年06月発売号 10,550億円・952億円・193億円2023年12月発売号 11,110億円・952億円・194億円次に、自己資本比率・1株当たり純資産・のれん・営業CFを見てみる。25年3月期 59.3%・2,571.35円・6,655百万円・19,17526年3月期 59.0%・2,737.09円・11,634百万円・26,21627年3月期 61.8%・2,941.01円・10,446円・9,01028年3月期 61.9%・3,199.10円・8,989円・31,07529年3月期 64.4%・1,738.87円・7,817百万円・23,72230年3月期 65.0%・1,935.39円・6,677百万円・27,9382019年3月期 65.7%・2,038.76円・5,756百万円・21,8972020年3月期 65.2%・2,233.54円・4,870百万円・24,7642021年3月期 66.8%・2,400.47円・4,029百万円・25,8752022年3月期 70.7%・3,285.02円・119,046百万円・39,812 2023年3月期 70.1%・3,460.75円・113,125百万円・64,061次に、期末発行済株式数(自己株式を含む)・期末自己株式数を見てみる。25年3月期末 53,579,014・953,67926年3月期末 54,629,307・83427年3月期末 54,636,107・1,001,81828年3月期末 54,636,107・1,002,57329年3月期末 109,272,214・3,457,394(分1→2)30年3月期末 109,272,214・3,446,8762019年3月期末 109,272,214・6,648,1682020年3月期末 109,272,214・6,627,0962021年3月期末 109,272,214・6,618,0222022年3月期末 142,966,710・1,636,0202023年3月期末 142,966,710・3,566,351次に、株価と指標等を見てみる。3月15日の終値は、2,371円予想PERは、19.97倍実績PBRは、1.97倍予想利回りは、1.42%GMOクリック証券によると、・理論株価は、1,016円。(事業価値821円+財産価値247円-有利子負債51円)・理論株価比は、233.4%。(現在値÷理論株価)最後に、四季報12月号の記事を見てみる。【決算】3月【設立】2007.10【上場】2007.10【特色】都市型ドラッグストアの草分け。PBや化粧品、医薬品に強み。21年10月にココカラと経営統合【連結事業】マツモトキヨシG60(7)、ココカラファインG40(5)、管理サポート0(1) <23・3>【上振れ】店舗純増80(前期84増)。好採算の医薬品が訪日客増を追い風に販売想定超。化粧品も貢献。のれん償却費重いが統合効果でカバーし増益幅拡大。増配。25年3月期も医薬品が牽引し連続営業増益。【旗艦店】23年9月末渋谷で改装、SNSで話題の新商品展開等で若年層囲い込む。統合2社のECサイトとアプリも一体化、会員基盤活用しクーポンなど精度向上。
2024/03/24
コメント(0)
-

征野ファンドの運用状況---対TOPIXは不調ながら、今週は大きく上げた。
3月22日時点の征野ファンドの運用状況です。昨年末比は、■征野ファンド・・・・+17.01%。■トピックスは・・・・+18.88%。で、トピックスを下回る成績になっています。(トピックスの終値は、2813.22)組入上位5銘柄は、1.信越化学工業(4063)2.光通信(9435)3.伊藤忠商事(8001)4.トヨタ自動車(7203)5.iSTOPIX(1475)で、前週末と比べると、順位の変動はありますが、銘柄は同じです。売買の詳細は、こちら。
2024/03/23
コメント(2)
-

住信SBIネット銀行を買い増し
今週(3/18~3/22)の売買は、1329 iS225 買い増し。1475 iSTOPIX 買い増し。6197 ソラスト 買い増し。7163 住信SBIネット銀行 買い増し。6197 ソラスト 一部売り。その他に、売付中の銘柄が1銘柄あります。
2024/03/23
コメント(0)
-

アルコニックス(3036)---25年3月期はIT機器や家電向け需要底打ち営業益小幅増。
アルコニックス(3036.金属製品販売)を見ておきます。関連日記 まずは、メモ書きです。・保有銘柄。・29年3月期の1株当たり純資産は、前期比が108.6%、3期前比が153.3%、5期前比が234.3%。・30年3月期の1株当たり純資産は、前期比が113.4%、3期前比が138.7%、5期前比が235.8%。・31年3月期の1株当たり純資産は、前期比が104.6%、3期前比が128.9%、5期前比が181.9%。・2020年3月期の1株当たり純資産は、前期比が106.0%、3期前比が125.7%、5期前比が153.7%。・2021年3月期の1株当たり純資産は、前期比が108.3%、3期前比が120.1%、5期前比が147.9%。・2022年3月期の1株当たり純資産は、前期比が110.5%、3期前比が126.8%、5期前比が150.5%。・2023年3月期の1株当たり純資産は、前期比が109.8%、3期前比が131.5%、5期前比が145.7%。次に、経常利益を見てみる。2015年(平成27年)3月期 5,2052016年(平成28年)3月期 4,2812017年(平成29年)3月期 4,3522018年(平成30年)3月期 7,9392019年(平成31年)3月期 6,2542020年(令和02年)3月期 5,4162021年(令和03年)3月期 5,7182022年(令和04年)3月期 11,0092023年(令和05年)3月期 8,176次に、1株配・配当金総額・配当性向・純資産配当率を見てみる。2011年3月期 12.5円・317百万円・14.7%・2.8%2012年3月期 15円・381百万円・15.6%・3.0%2013年3月期 15円・381百万円・26.6%・2.6%2014年3月期 16.25円・413百万円・13.1%・2.5%2015年3月期 20円・511百万円・14.6%・2.2%2016年3月期 22円・566百万円・11.4%・2.0%2017年3月期 22円・567百万円・18.4%・1.8%2018年3月期 32円・827百万円・15.5%・2.4%2019年3月期 39円・1,000百万円・25.1%・2.7%2020年3月期 42円・1,068百万円・29.3%・2.7%2021年3月期 42円・1,053百万円・37.0%・2.6%2022年3月期 52円・1,450百万円・18.4%・2.9%2023年3月期 54円・1,625百万円・29.6%・2.7%2024年3月期 54円次に、四季報で株主数・外人比率・特定株比率を見てみる。・2,986名<16.3>・21.0%・42.6%・2,553名<17.3>・21.2%・45.4%・4,131名<18.3>・21.7%・48.2%・8,441名<19.3>・19.4%・46.2%・10,113名<20.3>・21.2%・44.9%・10,640名<21.3>・20.7%・43.9%・21,157名<22.3>・20.3%・41.9%・27,266名<23.3>・19.1%・42.1%・30,973名<23.9>・19.7%・40.3%次に、四季報で時価総額・現金等・有利子負債を見てみる。2016年09月発売号 174億円・197億円・351億円2017年09月発売号 429億円・168億円・432億円2018年09月発売号 395億円・185億円・472億円2019年09月発売号 285億円・224億円・585億円2020年06月発売号 328億円・215億円・516億円2021年06月発売号 397億円・260億円・591億円2022年06月発売号 406億円・259億円・617億円2023年06月発売号 415億円・258億円・718億円2023年12月発売号 410億円・258億円・690億円次に、自己資本比率・1株当たり純資産・のれん・営業CFを見てみる。24年3月期 19.8%・2,143.39円・14百万円・5,79725年3月期 21.8%・2,414.98円・2,528百万円・7,05626年3月期 24.3%・1,638.21円・2,736百万円・1,99227年3月期 29.3%・2,053.83円・2,784百万円・55028年3月期 26.8%・2,311.32円・4,262百万円・10,63029年3月期 28.5%・2,511.23円・3,660百万円・14030年3月期 28.2%・1,423.87円・3,478百万円・2,84931年3月期 26.3%・1,489.59円・3,714百万円・5,2792020年3月期 30.1%・1,578.62円・3,120百万円・9,0912021年3月期 28.9%・1,709.55円・2,548百万円・4,0982022年3月期 32.2%・1,889.53円・1,887百万円・△3,3292023年3月期 32.6%・2,075.25円・1,357百万円・226次に、期末発行済株式数(自己株式を含む)・期末自己株式数を見てみる。25年3月期末 6,355,200・11426年3月期末 6,358,800・18527年3月期末 12,813,200・413(分1→2)28年3月期末 12,875,600・41329年3月期末 12,894,000・41330年3月期末 25,864,800・961(分1→2)31年3月期末 25,882,200・437,6352020年3月期末 25,915,700・272,0712021年3月期末 25,943,100・907,2072022年3月期末 30,977,000・907,2072023年3月期末 31,012,500・907,207次に、株価と指標等を見てみる。3月15日の終値は、1,436円予想PERは、10.26倍実績PBRは、0.65倍予想利回りは、3.76%GMOクリック証券によると、・理論株価は、2,755円。(事業価値4,026円+財産価値1,121円-有利子負債2,391円)・理論株価比は、52.1%。(現在値÷理論株価)最後に、四季報12月号の記事を見てみる。【決算】3月【設立】1981.7【上場】2006.4【特色】双日の非鉄販社が分離独立。商社機能と製造業を融合した非鉄金属の総合企業。M&Aに積極的【連結事業】商社流通電子機能材23(9)、商社流通アルミ銅37(2)、製造装置材料23(2)、製造金属加工17(8)【海外】42 <23・3>【減 額】アルミ銅は自動車向けが回復だが、電子機能材はIT端末機器向けが低迷。装置材料は価格転嫁進めるが数量低下痛い。金属加工は半導体実装装置向けが想定以下。一転営業減益。25年3月期はIT機器や家電向け需要底打ち営業益小幅増。【再資源化】24年末までに北九州市で非鉄金属リサイクルセンター完工。台湾とタイでタングステンのリサイクル事業強化。
2024/03/22
コメント(0)
-

ヱスビー食品(2805)---25年3月期はコンビニ向け食品製造事業譲渡で減収。
ヱスビー食品(2805.調味料)を見ておきます。関連日記まずは、メモ書きです。・保有銘柄。・31年3月期の1株当たり純資産は、前期比が108.3%、3期前比が130.2%、5期前比が151.5%。・2020年3月期の1株当たり純資産は、前期比が109.3%、3期前比が130.0%、5期前比が151.6%。・2021年3月期の1株当たり純資産は、前期比が115.6%、3期前比が136.9%、5期前比が164.6%。・2022年3月期の1株当たり純資産は、前期比が111.6%、3期前比が141.0%、5期前比が167.8%。・2023年3月期の1株当たり純資産は、前期比が107.5%、3期前比が138.7%、5期前比が164.2%。次に、経常利益を見てみる。2015年(平成27年)3月期 4,1262016年(平成28年)3月期 4,2442017年(平成29年)3月期 5,1222018年(平成30年)3月期 6,1892019年(平成31年)3月期 7,0712020年(令和02年)3月期 7,1212021年(令和03年)3月期 9,3832022年(令和04年)3月期 8,7092023年(令和05年)3月期 5,465次に、1株配・配当金総額・配当性向・純資産配当率を見てみる。2018年3月期 40円・508百万円・13.1%・1.3%2019年3月期 40円・508百万円・11.8%・1.2%2020年3月期 44円・558百万円・10.2%・1.2%2021年3月期 46円・584百万円・8.8%・1.1%2022年3月期 50円・626百万円・10.2%・1.1%2023年3月期 54円・660百万円・16.3%・1.1%2024年3月期 62円次に、四季報で株主数・外人比率・特定株比率を見てみる。・6,726名<20.3>・0.9%・52.5%・7,126名<21.3>・1.5%・48.8%・9,935名<22.3>・2.7%・44.4%・12,748名<23.3>・2.7%・43.4%・13,002名<23.9>・3.3%・43.4%次に、四季報で時価総額・現金等・有利子負債を見てみる。2019年12月発売号 565億円・179億円・376億円2020年06月発売号 557億円・220億円・344億円2021年06月発売号 646億円・255億円・339億円2022年06月発売号 493億円・252億円・330億円2023年06月発売号 482億円・207億円・310億円2023年12月発売号 538億円・207億円・340億円次に、自己資本比率・1株当たり純資産・のれん・営業CFを見てみる。26年3月期 31.3%・4,534.20円・16百万円・6,72527年3月期 32.6%・4,953.29円・13百万円・3,62728年3月期 33.1%・5,275.16円・0円・3,49929年3月期 35.0%・5,773.56円・0円・8,55030年3月期 39.1%・3,170.83円・0円・3,11131年3月期 39.8%・3,434.68円・0円・5,2482020年3月期 39.7%・3,754.21円・0円・12,1582021年3月期 44.0%・4,341.44円・0円・11,3132022年3月期 46.4%・4,843.38円・0円・8,170 2023年3月期 48.2%・5,207.10円・0円・641次に、期末発行済株式数(自己株式を含む)・期末自己株式数を見てみる。26年3月期末 6,977,117・33,44027年3月期末 6,977,117・204,08728年3月期末 6,977,117・398,46729年3月期末 6,977,117・626,10430年3月期末 13,954,234・1,253,372(分1→2)31年3月期末 13,954,234・1,253,7502020年3月期末 13,954,234・1,253,8642021年3月期末 13,954,234・1,254,0442022年3月期末 13,622,234・1,254,1352023年3月期末 13,622,234・1,537,671次に、株価と指標等を見てみる。3月15日の終値は、4,360円予想PERは、11.97倍実績PBRは、0.78倍予想利回りは、1.42%GMOクリック証券によると、・理論株価は、6,588円。(事業価値6,856円+財産価値2,356円-有利子負債2,624円)・理論株価比は、66.2%。(現在値÷理論株価)最後に、四季報12月号の記事を見てみる。【決算】3月【設立】1940.4【上場】1961.10【特色】カレー粉が創業事業。スパイスシェア6割程度で首位。即席カレー、パスタソースも高シェア【連結事業】食料品89(4)、調理済食品11(6) <23・3>【上向く】ゴールデンカレーなど主力の即席カレーが値上げ効果で牽引。中華系調味料も伸長。パスタソースも小幅増。後半にかけ採算改善し営業益上向く。100周年配。25年3月期はコンビニ向け食品製造事業譲渡で減収。原料高落ち着き小幅増益。【転 嫁】23年12月業務用製品値上げ。それ以降値上げ予定なし。火災発生の食品製造工場は同10月以降徐々に生産回復進む。
2024/03/21
コメント(2)
-

エフティグループ(2763)---25年3月期は電力小売りの好調見込み連続増益。
エフティグループ(2763.法人向けOA機器・関連用品販売)を見ておきます。関連日記まずは、メモ書きです。・保有銘柄。・29年3月期の1株当たり純資産は、前期比が104.2%、3期前比が151.8%、5期前比が275.8%。・30年3月期の1株当たり純資産は、前期比が110.1%、3期前比が135.2%、5期前比が227.8%。・31年3月期の1株当たり純資産は、前期比が109.7%、3期前比が125.9%、5期前比が183.3%。・2020年3月期の1株当たり純資産は、前期比が110.1%、3期前比が132.9%、5期前比が163.1%。・2021年3月期の1株当たり純資産は、前期比が106.1%、3期前比が128.0%、5期前比が146.9%。・2022年3月期の1株当たり純資産は、前期比が116.5%、3期前比が135.9%、5期前比が164.2%。・2023年3月期の1株当たり純資産は、前期比が113.2%、3期前比が139.8%、5期前比が168.7%。次に、税引前利益を見てみる。2013年(平成25年)3月期 3,2852014年(平成26年)3月期 4,1132015年(平成27年)3月期 4,5382016年(平成28年)3月期 4,8352017年(平成29年)3月期 4,1652018年(平成30年)3月期 4,8082019年(平成31年)3月期 5,6832020年(令和02年)3月期 6,2822021年(令和03年)3月期 5,5482022年(令和04年)3月期 6,4752023年(令和05年)3月期 5,851次に、1株配・配当金総額・配当性向・純資産配当率を見てみる。2016年3月期 24円・828百万円・28.5%・7.4%2017年3月期 34円・1,135百万円・50.4%・9.5%2018年3月期 42円・1,396百万円・50.1%・11.0%2019年3月期 58円・1,890百万円・51.0%・13.8%2020年3月期 61円・1,937百万円・50.2%・13.1%2021年3月期 63円・1,959百万円・62.3%・12.6%2022年3月期 63円・1,949百万円・40.5%・11.3%2023年3月期 55円・1,676百万円・46.6%・8.6%2024年3月期 55円次に、四季報で株主数・外人比率・特定株比率を見てみる。・2,785名<16.9>・6.3%・77.1%・3,750名<17.3>・4.5%・78.4%・5,111名<18.3>・4.5%・77.9%・4,062名<19.3>・3.3%・80.5%・4,016名<20.3>・2.1%・81.1%・4,758名<21.3>・1.6%・80.4%・6,067名<22.3>・1.4%・78.1%・6,104名<23.3>・1.7%・77.4%・5,923名<23.9>・2.2%・78.5%次に、四季報で時価総額・現金等・有利子負債を見てみる。2017年03月発売号 277億円・80億円・47億円2017年09月発売号 337億円・73億円・40億円2018年09月発売号 698億円・100億円・40億円2019年09月発売号 523億円・117億円・107億円2020年06月発売号 437億円・89億円・103億円2021年06月発売号 424億円・127億円・162億円2022年06月発売号 292億円・83億円・92億円2023年06月発売号 319億円・171億円・51億円2023年12月発売号 379億円・171億円・41億円次に、親会社所有者帰属持分比率・1株当たり親会社所有者帰属持分・のれん・営業CFを見てみる。24年3月期 24.1%・39,621.35円・54,788千円・2,10525年3月期 31.2%・52,830.82円・35,266千円・4,75826年3月期 49.3%・720.01円・21,000千円・2,93927年3月期 53.5%・890.49円・14,000千円・4,36228年3月期 56.6%・349.52円・70,096千円・1,39129年3月期 51.5%・364.31円・540,055千円・△56330年3月期 51.5%・401.17円・411,303千円・4,69831年3月期 46.3%・439.93円・280,553千円・1,2462020年3月期 47.1%・484.22円・404百万円・1,1762021年3月期 39.2%・513.55円・326百万円・△1,1002022年3月期 54.0%・598.05円・183百万円・1,6132023年3月期 62.8%・676.97円・116百万円・14,964次に、期末発行済株式数(自己株式を含む)・期末自己株式数を見てみる。24年3月期末 110,020・1,94725年3月期末 115,090・1,94726年3月期末 11,861,400・194,72827年3月期末 11,933,000・194,72828年3月期末 35,959,500・1,584,264(分1→3)29年3月期末 36,283,200・3,057,96430年3月期末 36,298,200・3,057,96431年3月期末 36,298,200・3,815,8512020年3月期末 33,262,316・1,666,8482021年3月期末 32,022,268・1,080,0002022年3月期末 32,022,268・1,080,0032023年3月期末 30,822,268・476,903次に、株価と指標等を見てみる。3月15日の終値は、1,232円予想PERは、9.06倍実績PBRは、1.7倍予想利回りは、4.46%GMOクリック証券によると、・理論株価は、1,977円。(事業価値1,610円+財産価値538円-有利子負債170円)・理論株価比は、62.3%。(現在値÷理論株価)最後に、四季報12月号の記事を見てみる。【決算】3月【設立】1985.8【上場】2003.3【特色】中小企業向け電話機やOA機器、LED照明販売が柱、電力小売りも行う。光通信子会社【連結事業】ネットワークインフラ64(10)、法人ソリューション36(24)、他0(8) <23・3>【上振れ】中小企業向けファイルサーバー、セキュリティ機器が好調。光回線サービス堅調。電力小売りは減収幅と調達価格が想定以下。前号より増益幅拡大。25年3月期は電力小売りの好調見込み連続増益。【法人向け】個人向けが主力だった光回線サービスを情報通信機器顧客の法人向けに拡大すべく営業展開。LED照明、次世代節水装置等の環境関連商材の拡販に注力。
2024/03/20
コメント(0)
-

プレミアムウォーターHD(2588)---期末165万契約(7%増)視野。
プレミアムウォーターHD(2588.食材宅配)を見ておきます。関連日記まずは、メモ書きです。・保有銘柄。・2022年3月期の1株当たり親会社所有者帰属持分は、前期比が147.0%、3期前比が559.8%、5期前比が824.0%。・2023年3月期の1株当たり親会社所有者帰属持分は、前期比が146.9%、3期前比が234.5%。次に、税前利益を見てみる。2018年(平成30年)3月期 -1,5592019年(平成31年)3月期 2592020年(令和02年)3月期 1,4722021年(令和03年)3月期 3,9422022年(令和04年)3月期 5,4652023年(令和05年)3月期 6,416次に、1株配・配当金総額・配当性向・純資産配当率を見てみる。2021年3月期 0円・0百万円・0%・0%2022年3月期 20円・586百万円・16.7%・6.2%2023年3月期 60円・1,770百万円・29.4%・12.6%2024年3月期 70円次に、四季報で株主数・外人比率・特定株比率を見てみる。・1,821名<22.9>・2.6%・90.6%・2,877名<23.3>・2.5%・90.5%・2,757名<23.9>・1.4%・92.1%次に、四季報で時価総額・現金等・有利子負債を見てみる。2022年12月発売号 715億円・203億円・477億円2023年06月発売号 729億円・257億円・535億円2023年12月発売号 815億円・257億円・510億円次に、親会社所有者帰属持分比率 ・1株当たり親会社所有者帰属持分 ・のれん・営業CFを見てみる。2017年3月期 7.1%・46.91円・104,698千円・1502018年3月期 11.7%・△1.47円・75,625千円・5312019年3月期 5.9%・69.05円・75,625千円・4,7812020年3月期 15.7%・242.12円・149,219千円・6,6592021年3月期 17.0%・262.96円・75百万円・9,4482022年3月期 19.5%・386.56円・75百万円・7,9912023年3月期 22.6%・567.71円・75百万円・13,814次に、期末発行済株式数(自己株式を含む)・期末自己株式数を見てみる。2017年3月期末 26,532,432・2182018年3月期末 27,003,082・2762019年3月期末 27,412,772・3122020年3月期末 27,567,002・3342021年3月期末 29,004,702・3722022年3月期末 29,335,132・34,1012023年3月期末 29,570,192・34,143次に、株価と指標等を見てみる。3月15日の終値は、3,260円予想PERは、19.31倍実績PBRは、4.84倍予想利回りは、2.15%GMOクリック証券によると、・理論株価は、1,119円。(事業価値2,078円+財産価値849円-有利子負債1,808円)・理論株価比は、291.3%。(現在値÷理論株価)最後に、四季報12月号の記事を見てみる。【決算】3月【設立】2006.10【上場】2013.3【特色】宅配水シェア3割超の国内首位。富士山などの天然水を製造・販売。デモ販売強く独自配送網も【連結事業】ナチュラルミネラルウォーター販売66、ウォーターサーバーレンタル24、他10 <23・3>【続 伸】猛暑長引き天然水好調。コロナ収束しデモ販売拡大、岐阜第1工場フル稼働。テレマーケ人件費こなす。期末165万契約(7%増)視野。自社物流高まり宅配費減少。営業益続伸。税平常化。25年3月期は第2工場稼働、量産効果で償却補う。【資本提携】持分40%のラストワンマイルが代理店首位に。クラフトビール会社にも40%出資、当社が天然水顧客へビール提供。
2024/03/19
コメント(0)
-

日清食品HD(2897)---海外は米州、欧州軸に伸長、高価格帯拡充も効く。
日清食品HD(2897.即席めん)を見ておきます。関連日記まずは、メモ書きです。・買付候補銘柄。・2023年3月期の1株当たり株主資本は、前期比が106.7%、3期前比が134.9%、5期前比が134.1%。次に、税前利益を見てみる。2019年(平成31年)3月期 31,1662020年(令和02年)3月期 42,6502021年(令和03年)3月期 56,2332022年(令和04年)3月期 49,1822023年(令和05年)3月期 57,950次に、1株配・配当金総額・配当性向・純資産配当率を見てみる。2022年3月期 43.333円・13,359百万円・37.8%・3.4%2023年3月期 46.667円・14,188百万円・31.8%・3.4%2024年3月期 66.667円次に、四季報で株主数・外人比率・特定株比率を見てみる。・52,789名<23.9>・24.2%・44.3%次に、四季報で時価総額・現金等・有利子負債を見てみる。2023年12月発売号 15,310億円・873億円・422億円次に、親会社所有者帰属持分比率・1株当たり親会社所有者帰属持分・営業CFを見てみる。2018年3月期 62.4%・3,166.83円・44,8932019年3月期 58.6%・3,137.40円・40,7402020年3月期 56.9%・3,148.62円・57,5332021年3月期 57.9%・3,686.38円・72,7142022年3月期 59.6%・3,979.66円・52,936 2023年3月期 60.8%・4,247.09円・64,809次に、期末発行済株式数(自己株式を含む)・期末自己株式数を見てみる。2018年3月期末 117,463,685・13,329,2982019年3月期末 105,700,000・1,543,2662020年3月期末 105,700,000・1,529,3202021年3月期末 105,700,000・1,528,2362022年3月期末 104,222,300・1,786,4062023年3月期末 102,861,500・1,515,187次に、株価と指標等を見てみる。3月8日の終値は、4,221円予想PERは、22.97倍実績PBRは、2.66倍予想利回りは、1.58%GMOクリック証券によると、・理論株価は、1,519円。(事業価値1,207円+財産価値554円-有利子負債242円)・理論株価比は、277.9%。(現在値÷理論株価)最後に、四季報12月号の記事を見てみる。【決算】3月【設立】1948.9【上場】1963.10【特色】即席ラーメンの先駆者。カップ麺は06年明星食品子会社化で国内シェア5割超。袋麺も首位級【連結事業】即席めん関連81、他19【海外】37 <23・3>【好 調】国内は即席麺が原料高と値上げで横ばいだが、日清ヨークの乳酸菌飲料、湖池屋が牽引。海外は米州、欧州軸に伸長、高価格帯拡充も効く。下期販促費増あっても会社営業益を超過。連続増配。25年3月期も海外貢献続く。国内即席麺は改善傾向。【施 策】定番品や高付加価値品の販促に注力、低価格帯から回帰進める。乳酸菌飲料『ピルクル』も費用投入し需要定着狙う。
2024/03/18
コメント(0)
-
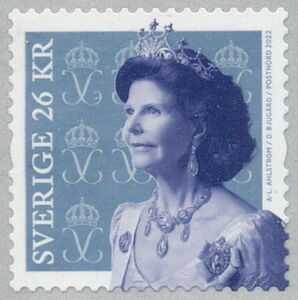
2022年1月13日発行のスウェーデンの切手には、シルヴィア王妃が描かれている。
画像は、2022年1月13日発行の、スウェーデンの切手。描かれている人物は、シルヴィア王妃。シルヴィア王妃は、1943年12月23日生まれなので、この切手が発行された時の年齢は78歳。そして、現在の年齢は、80歳になる。この切手の左側に大きく書かれている、SVERIGE(スヴェーリエ)は、スウェーデン語で、スヴェーリア族の国という意味です。そして、この切手の額面は、26スウェーデン・クローナ。日本円に換算すると、374.86円になります。(1SEK=14.42JPY)
2024/03/18
コメント(0)
-

ナブテスコ(6268)---減速機需要の冷え込みを受け、23年10月に予定していた浜松新工場稼働は24年に延期。
ナブテスコ(6268.産業機械)を見ておきます。関連日記まずは、メモ書きです。・買付候補銘柄。・2019年12月期の1株当たり純資産は、前期比が104.9%、3期前比が126.4%、5期前比が127.4%。・2020年12月期の1株当たり純資産は、前期比が105.7%、3期前比が117.6%、5期前比が138.6%。・2021年12月期の1株当たり純資産は、前期比が125.4%、3期前比が139.0%、5期前比が167.5%。・2022年12月期の1株当たり純資産は、前期比が103.6%、3期前比が137.3%、5期前比が152.8%。・2023年12月期の1株当たり純資産は、前期比が104.7%、3期前比が136.1%、5期前比が150.8%。次に、税前利益を見てみる。2017年(平成29年)12月期 34,9072018年(平成30年)12月期 29,9622019年(令和01年)12月期 27,9792020年(令和02年)12月期 33,7182021年(令和03年)12月期 101,9662022年(令和04年)12月期 15,7632023年(令和05年)12月期 25,629次に、1株配・配当金総額・配当性向・純資産配当率を見てみる。2018年12月期 73円・9,071百万円・43.0%・5.2%2019年12月期 73円・9,078百万円・50.5%・5.0%2020年12月期 75円・9,327百万円・45.4%・4.8%2021年12月期 77円・9,265百万円・14.4%・4.3%2022年12月期 78円・9,385百万円・98.9%・3.8%2023年12月期 80円・9,638百万円・66.0%・3.8%2024年12月期 80円次に、四季報で株主数・外人比率・特定株比率を見てみる。・18,032名<20.6>・46.2%・33.6%・14,579名<20.12>・47.2%・35.0%・19,467名<21.12>・43.0%・39.0%・18,457名<22.12>・45.4%・41.1%・19,064名<23.6>・43.5%・42.2%次に、四季報で時価総額・現金等・有利子負債を見てみる。2020年12月発売号 5,311億円・586億円・404億円2021年03月発売号 5,818億円・646億円・398億円2022年03月発売号 3,825億円・1,127億円・175億円2023年06月発売号 3,752億円・1,244億円・180億円2023年12月発売号 3,332億円・1,244億円・209億円次に、親会社所有者帰属持分比率・1株当たり親会社所有者帰属持分・営業CFを見てみる。27年3月期 60.9%・1,184.17円・19,94927年12月期 60.9%・1,150.41円・8,7462016年12月期 57.6%・1,193.79円・27,7302017年12月期 55.6%・1,355.72円・23,0712018年12月期 54.4%・1,438.64円・24,1652019年12月期 54.4%・1,508.53円・38,4332020年12月期 56.3%・1,594.10円・34,2032021年12月期 49.8%・1,999.10円・36,340 2022年12月期 54.1%・2,071.87円・7,717 2023年12月期 61.7%・2,169.52円・11,177次に、期末発行済株式数(自己株式を含む)・期末自己株式数を見てみる。27年3月期末 128,265,799・1,710,99827年12月期末 125,133,799・1,639,4762016年12月期末 125,133,799・1,608,4762017年12月期末 125,133,799・1,888,2472018年12月期末 125,133,799・1,154,4032019年12月期末 125,133,799・1,013,3622020年12月期末 125,133,799・990,7492021年12月期末 121,064,099・1,091,2112022年12月期末 121,064,099・1,058,5502023年12月期末 121,064,099・1,025,536次に、株価と指標等を見てみる。3月8日の終値は、2,440円予想PERは、33.29倍実績PBRは、1.12倍予想利回りは、3.28%GMOクリック証券によると、・理論株価は、2,544円。(事業価値1,778円+財産価値1,146円-有利子負債381円)・理論株価比は、95.9%。(現在値÷理論株価)最後に、四季報12月号の記事を見てみる。【決算】12月【設立】2003.9【上場】2003.9【特色】産業ロボット用精密減速機で世界シェア6割、自動ドア世界首位級。鉄道用ブレーキも強い【連結事業】コンポーネント46(11)、トランスポート23(9)、アクセシビリティ25(4)、他6(8)【海外】47 <22・12>【小幅増益】柱の減速機は中国のEV投資需要減速が痛く想定以下。円安押し上げで営業益横ばい。24年12月期は油圧機器底ばいだが減速機が上向く。航空機器拡大。償却増こなし営業益小幅増。金融収益減る。【延 期】減速機需要の冷え込みを受け、23年10月に予定していた浜松新工場稼働は24年に延期。油圧機器は依存度高い中国で需要鈍く、欧米で営業増員等進め顧客開拓。
2024/03/17
コメント(0)
-

征野ファンドの運用状況---今週はやや下落。
3月15日時点の征野ファンドの運用状況です。昨年末比は、■征野ファンド・・・・+11.77%。■トピックスは・・・・+12.86%。で、トピックスを下回る成績になっています。(トピックスの終値は、2670.80)組入上位5銘柄は、1.信越化学工業(4063)2.光通信(9435)3.伊藤忠商事(8001)4.isTOPIX(1475)5.トヨタ自動車(7203)で、前週末と同じです。売買の詳細は、こちら。
2024/03/16
コメント(2)
-

ソラストの売買など
今週(3/11~3/15)の売買は、6197 ソラスト 買い増し。8473 SBIHD 買い増し。6197 ソラスト 一部売り。ソラスト(6197)は、株価下落により、含み損を抱えている。3月15日の終値532円で評価損等を計算すると、-583,360円。-100万は超えていると思っていたので、意外と少ない。
2024/03/16
コメント(0)
-

バリューHR(6078)---第三者割当で大和総研が2・6%保有株主に、契約団体拡大で相互連携。
バリューHR(6078.事務代行)を見ておきます。関連日記まずは、メモ書きです。・買付候補銘柄。・2019年12月期の1株当たり純資産は、前期比が114.9%、3期前比が121.4%、5期前比が141.0%。・2020年12月期の1株当たり純資産は、前期比が114.0%、3期前比が128.4%、5期前比が148.2%。・2021年12月期の1株当たり純資産は、前期比が161.5%、3期前比が211.6%、5期前比が223.6%。・2022年12月期の1株当たり純資産は、前期比が106.3%、3期前比が195.9%、5期前比が220.5%。・2023年12月期の1株当たり純資産は、前期比が110.8%、3期前比が190.3%、5期前比が249.3%。次に、経常利益を見てみる。2015年(平成27年)12月期 3282016年(平成28年)12月期 3582017年(平成29年)12月期 4482018年(平成30年)12月期 3922019年(令和01年)12月期 8062020年(令和02年)12月期 7432021年(令和03年)12月期 9892022年(令和04年)12月期 1,3122023年(令和05年)12月期 1,459次に、1株配・配当金総額・配当性向・純資産配当率を見てみる。2018年12月期 6.00円・140百万円・56.6%・4.1%2019年12月期 8.25円・195百万円・35.3%・8.1%2020年12月期 8.75円・200百万円・45.1%・7.5%2021年12月期 12.25円・310百万円・44.3%・7.5%2022年12月期 18.00円・475百万円・53.6%・5.8%2023年12月期 24.00円・634百万円・64.7%・10.6%2024年12月期 25.00円次に、四季報で株主数・外人比率・特定株比率を見てみる。・5,877名<19.12>・3.6%・50.3%・7,807名<20.12>・2.9%・50.0%・8,762名<21.12>・2.0%・56.2%・11,704名<22.12>・2.3%・56.7%・10,244名<23.6>・1.6%・57.5%次に、四季報で時価総額・現金等・有利子負債を見てみる。2020年03月発売号 182億円・23億円・58億円2021年03月発売号 218億円・27億円・71億円2022年03月発売号 325億円・50億円・70億円2023年06月発売号 379億円・48億円・63億円2023年12月発売号 396億円・48億円・61億円次に、自己資本比率・1株当たり純資産・のれん・営業CFを見てみる。26年12月期 36.0%・621.25円・0円・45227年12月期 38.2%・673.83円・0円・27428年12月期 40.4%・360.73円・0円・60329年12月期 39.9%・389.00円・0円・85330年12月期 21.0%・381.14円・0円・7712019年12月期 21.9%・437.84円・0円・1,2332020年12月期 21.5 %・249.67円・0円・582 2021年12月期 31.8%・403.29円・0円・1,144 2022年12月期 33.6%・214.43円・0円・1,864 2023年12月期 36.5%・237.52円・0円・1,346次に、期末発行済株式数(自己株式を含む)・期末自己株式数を見てみる。26年12月期末 2,696,600・027年12月期末 2,766,200・3428年12月期末 5,669,200・68(分1→2)29年12月期末 5,771,400・67,86830年12月期末 6,050,000・116,3212019年12月期末 6,077,800・158,5212020年12月期末 12,214,400・317,062(分1→2)2021年12月期末 13,270,000・217,1362022年12月期末 26,660,000・378,610(分1→2)2023年12月期末 27,383,200・885,635次に、株価と指標等を見てみる。3月8日の終値は、1,324円予想PERは、34.93倍実績PBRは、5.57倍予想利回りは、1.89%GMOクリック証券によると、・理論株価は、381円。(事業価値382円+財産価値230円-有利子負債231円)・理論株価比は、347.5%。(現在値÷理論株価)最後に、四季報12月号の記事を見てみる。【決算】12月【設立】2001.7【上場】2013.10【特色】健保の保健事業や企業の健康関連業務をネット代行。健保の新設・運営支援も。配当性向5割超【連結事業】バリューカフェテリア78(36)、HRマネジメント22(24) <22・12>【連続最高益】健康管理は健診システム利用料など順調。BPO・人材派遣も機械化効き、施設拡張費増こなす。24年12月期は前期伸び悩んだ契約団体数が新設5程度上乗せ想定、サービス利用料拡大。人件費増こなす。営業益続伸。株売却益見込まず。【提 携】第三者割当で大和総研が2・6%保有株主に、契約団体拡大で相互連携。システム開発等に手取り額8・9億円充当。
2024/03/15
コメント(0)
-

大塚商会(4768)---24年12月期も旺盛なDX需要を背景に、SIは堅調拡大。
大塚商会(4768.システム運用)を見ておきます。関連日記まずは、メモ書きです。・保有銘柄。・2019年12月期の1株当たり純資産は、前期比が112.9%、3期前比が136.6%、5期前比が158.8%。・2020年12月期の1株当たり純資産は、前期比が106.9%、3期前比が130.3%、5期前比が160.1%。・2021年12月期の1株当たり純資産は、前期比が107.7%、3期前比が130.0%、5期前比が157.4%。・2022年12月期の1株当たり純資産は、前期比が106.9%、3期前比が123.2%、5期前比が150.0%。・2023年12月期の1株当たり純資産は、前期比が107.4%、3期前比が123.7%、5期前比が149.4%。次に、経常利益を見てみる。2016年(平成28年)12月期 40,7802017年(平成29年)12月期 45,4602018年(平成30年)12月期 49,2852019年(令和01年)12月期 63,7062020年(令和02年)12月期 57,5502021年(令和03年)12月期 57,5672022年(令和04年)12月期 56,6392023年(令和05年)12月期 64,517次に、1株配・配当金総額・配当性向・純資産配当率を見てみる。2018年12月期 85円・16,116百万円・48.0%・7.3%2019年12月期 110円・20,856百万円・47.9 %・8.5%2020年12月期 115円・21,804百万円・55.5 %・8.1%2021年12月期 120円・22,752百万円・57.0%・7.9%2022年12月期 125円・23,700百万円・59.2%・7.7%2023年12月期 135円・25,596百万円・53.9%・7.7%2024年12月期 140円次に、四季報で株主数・外人比率・特定株比率を見てみる。・5,267名<19.6>・29.3%・56.7%・5,659名<20.12>・22.6%・57.5%・5,685名<21.12>・22.2%・63.2%・6,531名<22.12>・21.7%・65.7%・5,630名<23.6>・27.8%・63.5%次に、四季報で時価総額・現金等・有利子負債を見てみる。2019年12月発売号 8,455億円・1,515億円・65億円2020年12月発売号 9,671億円・1,761億円・65億円2021年03月発売号 9,652億円・1,789億円・65億円2022年03月発売号 8,426億円・2,057億円・65億円2023年06月発売号 9,842億円・2,032億円・61億円2023年12月発売号 11,362億円・2,032億円・61億円次に、自己資本比率・1株当たり純資産・のれん・営業CFを見てみる。26年12月期 53.4%・1,722.31円・0円・34,13027年12月期 53.3%・1,827.30円・0円・27,62128年12月期 55.2%・2,002.64円・0円・23,93229年12月期 56.0%・2,245.73円・0円・36,1532018年12月期 56.5%・1,211.63円・0円・38,6462019年12月期 56.2%・1,367.76円・0円・48,7622020年12月期 58.8%・1,462.80円・0円・32,4962021年12月期 61.4%・1,575.64円・0円・57,8732022年12月期 61.1%・1,684.53円・0円・29,1962023年12月期 61.1%・1,809.66円・0円・71,649次に、期末発行済株式数(自己株式を含む)・期末自己株式数を見てみる。26年12月期末 95,001,060・199,91027年12月期末 95,001,060・200,10428年12月期末 95,001,060・200,22729年12月期末 95,001,060・200,2272018年12月期末 190,002,120・400,868(分1→2)2019年12月期末 190,002,120・400,9082020年12月期末 190,002,120・400,9082021年12月期末 190,002,120・400,9302022年12月期末 190,002,120・401,0812023年12月期末 190,002,120・401,198次に、株価と指標等を見てみる。3月8日の終値は、6,539円予想PERは、25.99倍実績PBRは、3.61倍予想利回りは、2.14%GMOクリック証券によると、・理論株価は、3,487円。(事業価値2,304円+財産価値1,241円-有利子負債58円)・理論株価比は、187.5%。(現在値÷理論株価)最後に、四季報12月号の記事を見てみる。【決算】12月【設立】1961.12【上場】2000.7【特色】情報サービス大手でSIから保守まで一貫。中堅・中小に強み。オフィス通販『たのめーる』も【連結事業】システムインテグレーション63(10)、サービス&サポート37(4) <22・12>【好 調】柱のSIは機器の値上げの効果が想定超。営業外の持分益膨らむ。24年12月期も旺盛なDX需要を背景に、SIは堅調拡大。サポートも順調増。人件費の膨張こなす。営業連続増益。連続増配維持濃厚。【投 入】ファクスの送信元に自動で受け取り返信する複合機アプリを開発。中小企業のデジタル化を支援。保守の『たよれーる』に定額制のAI分析サービスを追加。
2024/03/14
コメント(0)
-

楽天グループ(4755)---24年12月期はEC、金融がカード軸に好伸。携帯は契約数が順調増。経費削減も進むが、なお営業赤字残る。
楽天グループ(4755.インターネット小売り)を見ておきます。関連日記 まずは、メモ書きです。・保有銘柄。・2024年の年初の時価総額ランキングでは、127位。・2023年の年初の時価総額ランキングでは、146位。・2022年の年初の時価総額ランキングでは、90位。・2021年の年初の時価総額ランキングでは、102位。・2020年の年初の時価総額ランキングでは、100位。・2019年の年初の時価総額ランキングでは、125位。・2018年の年初の時価総額ランキングでは、103位。・2017年の年初の時価総額ランキングでは、73位。・2016年の年初の時価総額ランキングでは、62位。・28年12月期の1株当たり純資産は、前期比が102.6%、3期前比が209.4%、5期前比が279.1%。・29年12月期の1株当たり純資産は、前期比が106.4%、3期前比が159.2%、5期前比が261.9%。・30年12月期の1株当たり純資産は、前期比が112.9%、3期前比が123.2%、5期前比が251.6%。・2019年12月期の1株当たり純資産は、前期比が94.7%、3期前比が113.7%、5期前比が170.2%。・2020年12月期の1株当たり純資産は、前期比が82.4%、3期前比が88.1%、5期前比が96.1%。・2021年12月期の1株当たり純資産は、前期比が154.8%、3期前比が120.7%、5期前比が145.0%。・2022年12月期の1株当たり純資産は、前期比が74.0%、3期前比が94.3%、5期前比が100.8%。・2023年12月期の1株当たり純資産は、前期比が76.3%、3期前比が87.4%、5期前比が68.2%。次に、税前利益を見てみる。2012年(平成24年)12月期 49,1062013年(平成25年)12月期 88,6102014年(平成26年)12月期 104,2452015年(平成27年)12月期 91,9872016年(平成28年)12月期 73,9232017年(平成29年)12月期 138,0822018年(平成30年)12月期 165,4232019年(令和01年)12月期 -44,5582020年(令和02年)12月期 -151,0162021年(令和03年)12月期 -212,6302022年(令和04年)12月期 -407,8942023年(令和05年)12月期 -217,741次に、1株配・配当金総額・配当性向・親会社所有者帰属持分配当率を見てみる。20年12月期 1.0円・1,308百万円・--・0.8%21年12月期 1.0円・1,309百万円・2.4%・0.7%22年12月期 2.0円・2,624百万円・7.5%・1.2%23年12月期 2.5円・3,283百万円・--・1.4% 24年12月期 3.0円・3,944百万円・19.2%・1.8%25年12月期 4.0円・5,271百万円・12.3%・2.0%26年12月期 4.5円・5,952百万円・8.4%・1.6%27年12月期 4.5円・6,410百万円・13.9%・1.1%28年12月期 4.5円・6,419百万円・16.9%・1.0%29年12月期 4.5円・6,060百万円・5.6%・0.9%30年12月期 4.5円・6,084百万円・4.3%・0.8%2019年12月期 4.5円・6,103百万円・--・0.8%2020年12月期 4.5円・6,131百万円・--・0.9%2021年12月期 4.5円・7,118百万円・--・0.8%2022年12月期 4.5円・7,157百万円・--・0.7%2023年12月期 0円2024年12月期 0円次に、四季報で株主数・外人比率・特定株比率を見てみる。・120,575名<15.12>・39.6%・52.9%・126,639名<16.12>・36.1%・53.5%・166,982名<17.12>・30.2%・56.0%・255,587名<18.12>・24.4%・55.6%・256,020名<19.12>・26.6%・56.8%・243,806名<20.12>・28.3%・57.2%・230,364名<21.12>・32.0%・62.8%・380,300名<22.12>・24.5%・61.3%・428,718名<23.6>・30.3%・48.7%次に、四季報で時価総額・現金等・有利子負債を見てみる。2015年12月発売号 22,953億円・4,286億円・5,881億円2016年03月発売号 14,713億円・5,010億円・6,491億円2017年03月発売号 16,201億円・5,482億円・7,111億円2018年03月発売号 13,631億円・7,008億円・10,157億円2019年03月発売号 11,993億円・9,902億円・12,341億円2020年03月発売号 13,571億円・14,785億円・17,270億円2021年03月発売号 16,741億円・30,213億円・24,874億円2022年03月発売号 15,409億円・44,103億円・34,029億円2023年03月発売号 10,610億円・46,943億円・49,127億円2023年12月発売号 12,398億円・46,943億円・48,133億円次に、親会社所有者帰属持分比率・1株当たり親会社所有者帰属持分・営業CFを見てみる。23年12月期 11.7%・170.89円・27,58524年12月期 12.1%・193.73円・19,50825年12月期 9.3%・227.70円・1,48526年12月期 11.5%・318.74円・111,86027年12月期 15.5%・464.80円・78,24528年12月期 14.8%・476.89円・30,70029年12月期 11.0%・507.32円・162,05630年12月期 10.5%・572.83円・145,6152019年12月期 8.0%・542.43円・318,3202020年12月期 4.9%・446.78円・1,041,3912021年12月期 6.5%・691.47円・582,7072022年12月期 4.0%・511.63円・△257,9472023年12月期 3.7%・390.53円・724,192次に、期末発行済株式数(自己株式を含む)・期末自己株式数を見てみる。23年12月期末 1,319,457,800・6,007,90024年12月期末 1,320,626,600・6,007,99625年12月期末 1,323,863,100・6,033,46626年12月期末 1,328,603,400・6,033,03427年12月期末 1,430,373,900・6,008,78828年12月期末 1,432,422,600・6,008,88829年12月期末 1,434,573,900・87,913,13830年12月期末 1,434,573,900・82,555,5382019年12月期末 1,434,573,900・78,318,9382020年12月期末 1,434,573,900・72,073,1372021年12月期末 1,581,735,100・2342022年12月期末 1,590,463,000・2442023年12月期末 2,142,140,300・384次に、株価と指標等を見てみる。3月8日の終値は、825.4円予想PERは、--倍実績PBRは、2.11倍予想利回りは、0%GMOクリック証券によると、・理論株価は、▲1,248円。(事業価値▲1,767円+財産価値2,838円-有利子負債2,319円)・理論株価比は、割高。(現在値÷理論株価)最後に、四季報12月号の記事を見てみる。【決算】12月【設立】1997.2【上場】2000.4【特色】ネット通販で国内双璧。金融、旅行など総合路線。19年携帯電話事業参入、通信インフラ外販も【連結事業】インターネットサービス51(7)、フィンテック31(15)、モバイル17(-134)【海外】16 <22・12>【赤字残る】EC、金融は好調だが赤字元凶の携帯は経費削減幅が想定以下。前号より営業赤字幅拡大。24年12月期はEC、金融がカード軸に好伸。携帯は契約数が順調増。経費削減も進むが、なお営業赤字残る。【携 帯】つながりやすい電波、プラチナバンド割り当て受け、24年にも利用開始で通信品質向上。楽天証券にみずほ証券が追加出資、楽天証券HD上場はいったん中止。
2024/03/13
コメント(2)
-

GMOインターネットグループ(9449)---24年12月期はインフラが決済やセキュリティ軸に続伸。広告回復。暗号資産低迷かわし、営業益反転増。
GMOインターネットグループ(9449.ネットインフラ構築)を見ておきます。関連日記まずは、メモ書きです。・保有銘柄。・28年12月期の1株当たり純資産は、前期比が101.3%、3期前比が160.7%、5期前比が217.3%。・29年12月期の1株当たり純資産は、前期比が111.4%、3期前比が153.0%、5期前比が212.3%。・30年12月期の1株当たり純資産は、前期比が120.0%、3期前比が135.4%、5期前比が214.7%。・2019年12月期の1株当たり純資産は、前期比が104.3%、3期前比が139.3%、5期前比が191.4%。・2020年12月期の1株当たり純資産は、前期比が98.1%、3期前比が122.7%、5期前比が138.5%。・2021年12月期の1株当たり純資産は、前期比が144.0%、3期前比が147.3%、5期前比が196.8%。・2022年12月期の1株当たり純資産は、前期比が100.8%、3期前比が142.4%、5期前比が178.1%。・2023年12月期の1株当たり純資産は、前期比が115.0%、3期前比が166.9%、5期前比が170.7%。次に、経常利益を見てみる。2012年(平成24年)12月期 9,1752013年(平成25年)12月期 10,941 2014年(平成26年)12月期 12,7342015年(平成27年)12月期 14,8572016年(平成28年)12月期 16,6862017年(平成29年)12月期 17,3152018年(平成30年)12月期 19,1352019年(令和01年)12月期 24,5062020年(令和02年)12月期 27,1362021年(令和03年)12月期 43,3932022年(令和04年)12月期 46,0252023年(令和05年)12月期 45,947次に、1株配・配当金総額・配当性向・純資産配当率を見てみる。18年12月期 3円・186百万円・---・2.9%19年12月期 0円20年12月期 7円・703百万円・33.3%・12.1%21年12月期 6円・600百万円・44.5%・8.7%22年12月期 7円・700百万円・31.7%・9.0%23年12月期 12円・1,413百万円・31.8%・9.9%24年12月期 13円・1,531百万円・33.9%・7.7%25年12月期 15円・1,767百万円・33.7%・7.7%26年12月期 17円・2,002百万円・34.3%・7.4%27年12月期 38円・4,476百万円・33.4%・13.0%28年12月期 21円・2,434百万円・33.7%・6.2%29年12月期 23円・2,656百万円・33.1%・6.4%30年12月期 29.5円・3,395百万円・---・7.1%2019年12月期 24.2円・2,751百万円・33.1%・5.2%2020年12月期 30.8円・3,391百万円・33.1%・6.5%2021年12月期 52.7円・5,785百万円・33.0%・9.3%2022年12月期 47.6円・5,085百万円・38.6%・7.1%2023年12月期 44.1円・4,689百万円・33.1%・6.1%2024年12月期 49.8円次に、四季報で株主数・外人比率・特定株比率を見てみる。・34,673名<14.12>・29.7%・60.3%・31,207名<15.12>・30.8%・57.1%・31,572名<16.12>・29.0%・60.7%・32,817名<17.6>・30.1%・61.1%・32,632名<18.12>・31.8%・60.7%・30,093名<19.6>・33.2%・61.0%・26,895名<20.12>・32.1%・64.6%・23,536名<21.12>・33.2%・68.1%・23,439名<22.12>・31.7%・71.3%・22,018名<23.6>・32.8%・71.%次に、四季報で時価総額・現金等・有利子負債を見てみる。2013年12月発売号 1,403億円・418億円・388億円2014年03月発売号 1,346億円・528億円・243億円2015年03月発売号 1,359億円・650億円・300億円2016年06月発売号 1,473億円・749億円・819億円2017年06月発売号 1,715億円・901億円・966億円2018年09月発売号 2,141億円・1,178億円・1,394億円2019年06月発売号 1,992億円・1,436億円・1,289億円2020年12月発売号 3,255億円・1,597億円・1,779億円2021年03月発売号 3,547億円・2,186億円・2,083億円2022年03月発売号 2,899億円・2,340億円・2,946億円2023年03月発売号 2,760億円・3,222億円・3,911億円2023年12月発売号 2,612億円・3,222億円・4,635億円次に、自己資本比率・1株当たり純資産・のれん・営業CFを見てみる。23年12月期 9.0%・156.87円・4,659百万円・12,37924年12月期 7.6%・178.86円・3,551百万円・13,72225年12月期 5.8%・212.12円・3,670百万円・14,15626年12月期 6.1%・248.14円・3,946百万円・14,50927年12月期 7.1%・336.50円・2,224百万円・△12,62428年12月期 6.7%・340.92円・3,857百万円・3,11829年12月期 6.1%・379.69円・2,310百万円・5,48130年12月期 7.0%・455.48円・1,843百万円・13,1272019年12月期 6.2%・474.95円・2,778百万円・7,5022020年12月期 4.8%・465.94円・657百万円・38,2772021年12月期 5.2%・670.99円・14,251百万円・△23,7832022年12月期 4.7%・676.28円・17,708百万円・25,6412023年12月期 4.7%・777.50円・15,957百万円・14,914次に、期末発行済株式数(自己株式を含む)・期末自己株式数を見てみる。23年12月期末 117,806,777・1,68424年12月期末 117,806,777・1,68425年12月期末 117,806,777・1,81126年12月期末 117,806,777・1,81127年12月期末 117,806,777・1,81128年12月期末 115,944,677・1,81129年12月期末 115,096,887・11,34730年12月期末 115,096,887・4,0042019年12月期末 113,242,987・1,8802020年12月期末 113,242,987・3,990,9552021年12月期末 111,893,046・2,283,3612022年12月期末 110,704,401・3,979,5622023年12月期末 110,113,337・3,951,867次に、株価と指標等を見てみる。3月4日の終値は、2,898円予想PERは、19.23倍実績PBRは、3.73倍予想利回りは、1.72%GMOクリック証券によると、・理論株価は、4,818円。(事業価値6,206円+財産価値4,071円-有利子負債5,459円)・理論株価比は、60.1%。(現在値÷理論株価)最後に、四季報12月号の記事を見てみる。【決算】12月【設立】1991.5【上場】1999.8【特色】上場子会社9社を持つ総合ネットグループ。インフラ、金融が中核。暗号資産、広告メディアも【連結事業】インターネットインフラ61(15)、インターネット広告・メディア13(6)、インターネット金融17(22)、他9(41) <22・12>【反 発】柱のネットインフラ快走。が、投資事業の大型売却ない。不採算引き当ても響き営業益反落。24年12月期はインフラが決済やセキュリティ軸に続伸。広告回復。暗号資産低迷かわし、営業益反転増。【ジョブ型】25年度入社の新卒生からクリエーターや営業等のジョブ型採用始め、高スキル人材狙い撃ち。モンゴルに現地法人を設立し、ネットインフラ構築など開拓。
2024/03/12
コメント(0)
-

浜松ホトニクス(6965)---新棟稼働などで償却負担重く、営業減益。
浜松ホトニクス(6965.光学部品)を見ておきます。関連日記まずは、メモ書きです。・買付候補銘柄。・2023年9月期の1株当たり純資産は、前期比が113.6%、3期前比が149.8%、5期前比が164.8%。次に、経常利益を見てみる。2019年(令和01年)9月期 26,2772020年(令和02年)9月期 22,6922021年(令和03年)9月期 34,6482022年(令和04年)9月期 58,8792023年(令和05年)9月期 59,415次に、1株配・配当金総額・配当性向・純資産配当率を見てみる。2022年9月期 72円・11,167百万円・27.0%・4.3% 2023年9月期 76円・11,789百万円・27.5%・3.9% 2024年9月期 76円次に、四季報で株主数・外人比率・特定株比率を見てみる。・23,764名<23.9>・36.0%・44.8%次に、四季報で時価総額・現金等・有利子負債を見てみる。2023年12月発売号 9,691億円・1,144億円・124億円次に、自己資本比率・1株当たり純資産・のれん・営業CFを見てみる。2018年9月期 78.9%・1,248.84円・0円・23,5792019年9月期 78.2%・1,311.11円・0円・30,875 2020年9月期 78.3%・1,373.79円・0円・23,321 2021年9月期 78.4%・1,527.65円・0円・39,9132022年9月期 76.6%・1,811.98円・0円・45,1262023年9月期 79.1%・2,057.75円・0円・34,253 次に、期末発行済株式数(自己株式を含む)・期末自己株式数を見てみる。2018年9月期末 165,011,568・10,213,9682019年9月期末 165,011,568・10,213,9682020年9月期末 165,027,259・10,213,9772021年9月期末 165,041,841・10,214,2502022年9月期末 165,052,729・10,214,3892023年9月期末 165,065,948・10,214,438次に、株価と指標等を見てみる。3月1日の終値は、5,407円予想PERは、22.81倍実績PBRは、2.63倍予想利回りは、1.41%GMOクリック証券によると、・理論株価は、3,107円。(事業価値2,415円+財産価値782円-有利子負債89円)・理論株価比は、174.0%。(現在値÷理論株価)最後に、四季報12月号の記事を見てみる。【決算】9月【設立】1953.9【上場】1984.8【特色】光検出器関連で高技術。光電子増倍管で世界シェア約90%。医用など高性能品多数。開発型企業【連結事業】電子管39(39)、光半導体44(33)、画像計測機器14(36)、他3(10)【海外】77 <23・9>【軟 調】非破壊検査装置はEV電池向けが需要旺盛、増産設備も貢献し拡大。だが、光半導体が医療機器向けで顧客の在庫調整影響受け縮小。半導体製造装置向けも一服。新棟稼働などで償却負担重く、営業減益。【開発強化】横浜市に新拠点開設し画像計測ソフトウェアの開発強化、注力中のモジュール開発にも生かす狙い。配当性向は30%以上を目安、自己株買い実施も適宜検討。
2024/03/11
コメント(0)
-

2019年10月16日発行の、ニウエの切手には、ヴィクトリア女王が描かれている。
画像は、2019年10月16日発行のニウエの切手。描かれている人物は、ヴィクトリア女王。この切手は、ヴィクトリア女王の生誕200年を記念して発行された切手になります。「Bicentenary of Birth of Queen Victoria」という名称の記念切手ですが、英語にはバイセンテナリーという200周年を表す言葉があることに、ちょっとした感動があります。そのヴィクトリア女王、ウィキペディアには、次のように書かれています。---引用開始ヴィクトリア(英語: Victoria、1819年5月24日 - 1901年1月22日)は、イギリス・ハノーヴァー朝第6代女王(在位:1837年6月20日 - 1901年1月22日)、初代インド皇帝(女帝)(在位:1877年1月1日 - 1901年1月22日)。---引用終了そして、ニウエという国は、人口が1,681人(2022年時点)で、バチカン市国に次いで世界で2番目に少ない国になります。最後に、この切手の額面は、1.40ニュージーランド・ドル。日本円に換算すると、128.44円になります。(1NZD=91.74JPY)
2024/03/11
コメント(0)
-

東計電算(4746)---システム開発が着実増。課金型の業種別ソフトは物流、小売り、通販が好伸。
東計電算(4746.システム運用)を見ておきます。関連日記まずは、メモ書きです。・保有銘柄。・28年12月期の1株当たり純資産は、前期比が108.0%、3期前比が129.0%、5期前比が162.6%。・29年12月期の1株当たり純資産は、前期比が111.4%、3期前比が130.0%、5期前比が162.8%。・30年12月期の1株当たり純資産は、前期比が104.2%、3期前比が125.3%、5期前比が149.6%。・2019年12月期の1株当たり純資産は、前期比が116.3%、3期前比が134.9%、5期前比が157.5%。・2020年12月期の1株当たり純資産は、前期比が102.8%、3期前比が124.5%、5期前比が149.7%。・2021年12月期の1株当たり純資産は、前期比が109.2%、3期前比が130.5%、5期前比が151.5%。・2022年12月期の1株当たり純資産は、前期比が102.6%、3期前比が115.2%、5期前比が139.6%。・2023年12月期の1株当たり純資産は、前期比が116.0%、3期前比が130.1%、5期前比が155.4%。次に、経常利益を見てみる。2012年(平成24年)12月期 1,9372013年(平成25年)12月期 2,3142014年(平成26年)12月期 2,3842015年(平成27年)12月期 2,6482016年(平成28年)12月期 2,6762017年(平成29年)12月期 2,9452018年(平成30年)12月期 3,2482019年(令和01年)12月期 3,6612020年(令和02年)12月期 3,2752021年(令和03年)12月期 4,2052022年(令和04年)12月期 5,1542023年(令和05年)12月期 5,727次に、1株配・配当金総額・配当性向・純資産配当率を見てみる。18年12月期 17.5円・327百万円・35.5%・3.3%19年12月期 20円・368百万円・33.5%・3.5%20年12月期 20円・367百万円・42.6%・3.4%21年12月期 19円・348百万円・38.6%・3.2%22年12月期 20円・367百万円・41.0%。3.1%23年12月期 18円・330百万円・42.8%・2.8%24年12月期 22.5円・413百万円・35.6%・3.1%25年12月期 22.5円・408百万円・30.2%・2.9%26年12月期 27.5円・498百万円・34.7%・3.2%27年12月期 32.5円・593百万円・34.6%・3.5%28年12月期 35円・641百万円・35.1%・3.4%29年12月期 40円・735百万円・36.3%・3.6%30年12月期 45円・828百万円・37.0%・3.7%2019年12月期 55円・1,012百万円・39.4%・4.2%2020年12月期 62.5円・1,155百万円・46.0%・4.3%2021年12月期 80円・1,424百万円・48.6%・5.2%2022年12月期 95円・1,693百万円・49.6%・5.9%2023年12月期 110円・1,962百万円・49.4%・6.2%2024年12月期 110円次に、四季報で株主数・外人比率・特定株比率を見てみる。・5,844名<14.12>・3.4%・71.9%・5,325名<15.12>・3.7%・72.8%・5,966名<16.12>・3.2%・72.9%・5,644名<17.12>・3.1%・75.2%・5,269名<18.12>・2.8%・76.6%・4,066名<19.6>・3.5%・77.8%・4,880名<20.12>・3.3%・78.9%・4,722名<21.12>・3.6%・82.8%・4,824名<22.12>・3.3%・82.8%・3,176名<23.6>・3.3%・84.0%次に、四季報で時価総額・現金等・有利子負債を見てみる。2013年12月発売号 138億円・15億円・0億円2014年03月発売号 133億円・18億円・0億円2015年03月発売号 162億円・15億円・0億円2016年06月発売号 166億円・14億円・1億円2017年06月発売号 225億円・11億円・0億円2018年06月発売号 302億円・15億円・0億円2019年06月発売号 279億円・20億円・0億円2020年12月発売号 402億円・15億円・0億円2021年03月発売号 400億円・16億円・0億円2022年03月発売号 464億円・20億円・0億円2023年06月発売号 566億円・32億円・0億円2023年12月発売号 656億円・32億円・0億円次に、自己資本比率・1株当たり純資産・のれん・営業CFを見てみる。23年12月期 84.2%・1,298.59円・3,399千円・1,53124年12月期 83.6%・1,444.41円・3,399千円・1,95825年12月期 82.6%・1,636.95円・3,399千円・1,89026年12月期 80.0%・1,808.09円・283千円・2,10227年12月期 82.7%・1,955.65円・0円・2,15428年12月期 84.8%・2,111.19円・0円・1,87229年12月期 82.6%・2,351.23円・7,999千円・2,31530年12月期 81.7%・2,449.59円・5,999千円・2,8422019年12月期 81.2%・2,848.54円・3,999千円・1,8632020年12月期 80.8%・2,927.57円・1,999千円・2,520 2021年12月期 81.9%・3,197.59円・0千円・4,9142022年12月期 82.5%・3,282.31円・0千円・4,472 2023年12月期 81.5%・1,903.71円・0千円・5,044次に、期末発行済株式数(自己株式を含む)・期末自己株式数を見てみる。23年12月期末 9,350,000・167,35124年12月期末 9,350,000・167,55525年12月期末 9,350,000・277,63326年12月期末 9,350,000・277,68027年12月期末 9,350,000・221,32728年12月期末 9,350,000・183,92729年12月期末 9,350,000・156,55730年12月期末 9,350,000・147,8072019年12月期末 9,350,000・147,8342020年12月期末 9,350,000・109,9952021年12月期末 9,350,000・449,7382022年12月期末 9,350,000・436,9382023年12月期末 18,700,000・857,052(分1→2)次に、株価と指標等を見てみる。3月1日の終値は、3,330円予想PERは、13.29倍実績PBRは、1.75倍予想利回りは、3.3%GMOクリック証券によると、・理論株価は、3,536円。(事業価値1,871円+財産価値1,670円-有利子負債5円)・理論株価比は、94.2%。(現在値÷理論株価)最後に、四季報12月号の記事を見てみる。【決算】12月【設立】1970.4【上場】2000.3【特色】独立系情報処理会社。システムの設計開発、運用(受託)やデータ処理業務など手がける。好財務【連結事業】情報処理・ソフトウェア開発90(26)、機器販売8(20)、リース他2(21) <22・12>【最高益更新】システム開発が着実増。課金型の業種別ソフトは物流、小売り、通販が好伸。人件費等吸収し増益。増配。24年12月期はソフト開発堅調。業種別ソフトが小売り向け高成長。営業益続伸。連続増配。【アプリ】インボイス等対応で、AI活用のOCR使った会計処理自動化アプリ拡販。スマホ特化型も投入。システム開発は課金型に傾斜。12月末基準日で株式2分割。
2024/03/10
コメント(0)
-

征野ファンドの運用状況---対TOPIXは、先週末よりも悪化
3月8日時点の征野ファンドの運用状況です。昨年末比は、■征野ファンド・・・・+12.83%。■トピックスは・・・・+15.23%。で、トピックスを下回る成績になっています。(トピックスの終値は、2726.80)組入上位5銘柄は、1.信越化学工業(4063)2.光通信(9435)3.伊藤忠商事(8001)4.isTOPIX(1475)5.トヨタ自動車(7203)で、前週末と比べると、順位の変動はありますが、銘柄は同じです。売買の詳細は、こちら。
2024/03/09
コメント(2)
-

iS225(1329)を買い増し
今週(3/4~3/8)の売買は、1329 iS225 買い増し。6197 ソラスト 買い増し。6197 ソラスト 一部売り。上記の他に、買い増しが1銘柄、一部売りが2銘柄あり。ソラスト(6197)は、3月5日に安値499円をつける。が、この株価は安すぎか、3月8日の終値521円まで戻す。でも、まだまだ含み損解消までは遠いです。
2024/03/09
コメント(0)
-

オリジナル設計(4642)---24年12月期は需要高まる浸水対策で浸水想定地域広げる調査案件が増勢。
オリジナル設計(4642.建設コンサル・地質調査)を見ておきます。関連日記まずは、メモ書きです。・保有銘柄。・29年12月期の1株当たり純資産は、前期比が120.0%、3期前比が141.4%、5期前比が175.9%。・30年12月期の1株当たり純資産は、前期比が107.9%、3期前比が137.9%、5期前比が179.1%。・2019年12月期の1株当たり純資産は、前期比が105.5%、3期前比が136.7%、5期前比が161.0%。・2020年12月期の1株当たり純資産は、前期比が102.7%、3期前比が116.9%、5期前比が149.4%。・2021年12月期の1株当たり純資産は、前期比が103.5%、3期前比が112.1%、5期前比が145.2%。・2022年12月期の1株当たり純資産は、前期比が103.7%、3期前比が110.2%、5期前比が125.5%。・2023年12月期の1株当たり純資産は、前期比が105.2%、3期前比が112.9%、5期前比が122.3%。次に、経常利益を見てみる。2015年(平成27年)12月期 4902016年(平成28年)12月期 5872017年(平成29年)12月期 1,0172018年(平成30年)12月期 9362019年(令和01年)12月期 8162020年(令和02年)12月期 6472021年(令和03年)12月期 6252022年(令和04年)12月期 7482023年(令和05年)12月期 787次に、1株配・配当金総額・配当性向・純資産配当率を見てみる。28年12月期 8円・54百万円・13.0%・1.1%29年12月期 12円・81百万円・8.2%・1.4%30年12月期 14円・95百万円・15.9%・1.6%2019年12月期 30円・176百万円・36.8%・3.2%2020年12月期 32円・188百万円・49.6%・3.3%2021年12月期 32円・190百万円・49.7%・3.2%2022年12月期 32円・190百万円・45.1%・3.1%2023年12月期 32円・190百万円・39.4%・3.0%2024年12月期 32円次に、四季報で株主数・外人比率・特定株比率を見てみる。・1,726名<18.12>・3.9%・61.2%・1,542名<19.6>・2.7%・72.5%・1,410名<20.12>・2.1%・74.6%・1,342名<21.12>・1.9%・76.5%・1,480名<22.12>・1.8%・74.3%・1,436名<23.6>・2.1%・74.7%次に、四季報で時価総額・現金等・有利子負債を見てみる。2018年12月発売号 75.8億円・27.9億円・0億円2019年03月発売号 63.0億円・37.3億円・0億円2020年12月発売号 75.6億円・30.2億円・0億円2021年03月発売号 74.3億円・26.6億円・0億円2022年03月発売号 67.4億円・28.3億円・0億円2023年06月発売号 64.5億円・30.2億円・0億円2023年12月発売号 74.1億円・30.2億円・0億円次に、自己資本比率・1株当たり純資産・のれん・営業CFを見てみる。24年12月期 76.7%・474.39円・0円・△25125年12月期 76.2%・503.04円・0円・26926年12月期 79.2%・590.25円・0円・35227年12月期 78.3%・653.26円・0円・47028年12月期 76.6%・695.54円・0円・63329年12月期 79.7%・834.66円・0円・43430年12月期 79.5%・900.82円・0円・1,4592019年12月期 78.6%・950.46円・0円・4262020年12月期 81.2%・975.92円・0円・△1022021年12月期 83.3%・1,009.67円・0円・2822022年12月期 81.0%・1,047.31円・0円・6912023年12月期 82.3%・1,101.67円・0円・399次に、期末発行済株式数(自己株式を含む)・期末自己株式数を見てみる。24年12月期末 7,796,800・328,87125年12月期末 7,796,800・329,60526年12月期末 7,796,800・1,109,66727年12月期末 7,796,800・1,109,66728年12月期末 7,796,800・1,109,26729年12月期末 7,796,800・1,107,73530年12月期末 7,796,800・1,026,9652019年12月期末 7,796,800・2,003,4652020年12月期末 7,796,800・1,956,441 2021年12月期末 7,796,800・1,938,5732022年12月期末 7,796,800・1,921,0332023年12月期末 7,796,800・1,902,933次に、株価と指標等を見てみる。3月1日の終値は、1,151円予想PERは、15.07倍実績PBRは、1.04倍予想利回りは、2.78%GMOクリック証券によると、・理論株価は、1,618円。(事業価値891円+財産価値736円-有利子負債9円)・理論株価比は、71.1%。(現在値÷理論株価)最後に、四季報12月号の記事を見てみる。【決算】12月【設立】1962.1【上場】1996.7【特色】上下水道、水質保全等の建設コンサル。都市施設向けの情報処理や非破壊検査ビジネスも展開【単独事業】建設コンサルタント部門92、情報処理部門8 <22・12>【横ばい圏】柱の自治体向け上下水道コンサルは大型管路の更新需要が堅調。ただ、計上期ずれあり、営業益は横ばい圏に減額。24年12月期は需要高まる浸水対策で浸水想定地域広げる調査案件が増勢。待遇改善の給与・賞与アップをこなし営業益好伸。【迅速化】チャット活用など地道な情報共有強化で業務進捗は順調。官民連携でPFIに準じたDBO方式で初選定され受注。
2024/03/08
コメント(0)
-

ユミルリンク(4372)---24年12月期はメール配信契約数と配信数が堅調増。
ユミルリンク(4372.ネット広告)を見ておきます。関連日記まずは、メモ書きです。・保有銘柄。・2021年12月期の1株当たり純資産は、前期比が141.1%。・2022年12月期の1株当たり純資産は、前期比が116.8%。・2023年12月期の1株当たり純資産は、前期比が121.9%、3期前比が200.8%。次に、経常利益を見てみる。2019年(令和01年)12月期 2332020年(令和02年)12月期 3262021年(令和03年)12月期 3982022年(令和04年)12月期 5202023年(令和05年)12月期 592次に、1株配・配当金総額・配当性向・純資産配当率を見てみる。2020年12月期 0円・0百万円・0%・0%2021年12月期 0円・0百万円・0%・0%2022年12月期 0円・0百万円・0%・0%2023年12月期 0円・0百万円・0%・0%2024年12月期 0円次に、四季報で株主数・外人比率・特定株比率を見てみる。・1,864名<21.12>・5.0%・77.5%・1,625名<22.6>・13.5%・79.1%・1,538名<22.12>・12.1%・81.0%・1,224名<23.6>・13.3%・83.3%次に、四季報で時価総額・現金等・有利子負債を見てみる。2022年03月発売号 50.5億円・15.1億円・0億円2022年12月発売号 44.7億円・15.1億円・0億円2023年03月発売号 47.5億円・17.2億円・0億円2023年09月発売号 48.5億円・17.2億円・0億円2023年12月発売号 47.0億円・17.2億円・0億円次に、自己資本比率・1株当たり純資産・のれん・営業CFを見てみる。2020年12月期 76.0%・308.66円・0円・3302021年12月期 80.8%・435.48円・0円・341 2022年12月期 81.5%・508.45円・0円・4442023年12月期 85.4%・619.91円・0円・458 次に、期末発行済株式数(自己株式を含む)・期末自己株式数を見てみる。2020年12月期末 3,554,400・02021年12月期末 3,892,600・02022年12月期末 3,892,600・84,6372023年12月期末 3,892,600・62,837次に、株価と指標等を見てみる。3月1日の終値は、1,270円予想PERは、11.58倍実績PBRは、2.05倍予想利回りは、0%GMOクリック証券によると、・理論株価は、1,530円。(事業価値997円+財産価値533円-有利子負債0円)・理論株価比は、83.0%。(現在値÷理論株価)最後に、四季報12月号の記事を見てみる。【決算】12月【設立】2000.5【上場】2021.9【特色】大規模、高速が特徴のメール配信システムを提供。通信・小売業が主要顧客。阪急阪神グループ【単独事業】Cuenoteシリーズ100、他0 <22・12>【堅 調】メール配信は大企業の新規顧客獲得や配信数が伸長。広告費や人件費増こなす。24年12月期はメール配信契約数と配信数が堅調増。SMSも自治体の導入進み配信数増。開発費増あるが営業増益続く。【機能向上】SMS配信サービスにメッセージ承認機能を追加。情報の誤送信を防止。情報量などSMSを高機能化した新チャネルは24年12月期中に投入。開発急ピッチ。
2024/03/07
コメント(0)
-

アクセス数820万、御来訪御礼申し上げます。
アクセス数が820万に達しました。いつも御来訪いただき、ありがとうございます。今後ともよろしくお願いいたします。810万アクセス時の日記は、こちらです。総アクセス数:8200778開設日数:7404日(開設日:2003/11/30)810万~820万に達するまでの日数は、80日800万~810万に達するまでの日数は、58日790万~800万に達するまでの日数は、70日780万~790万に達するまでの日数は、79日770万~780万に達するまでの日数は、73日760万~770万に達するまでの日数は、87日750万~760万に達するまでの日数は、75日740万~750万に達するまでの日数は、40日730万~740万に達するまでの日数は、47日720万~730万に達するまでの日数は、42日710万~720万に達するまでの日数は、42日700万~710万に達するまでの日数は、40日690万~700万に達するまでの日数は、45日680万~690万に達するまでの日数は、43日670万~680万に達するまでの日数は、44日660万~670万に達するまでの日数は、46日650万~660万に達するまでの日数は、54日640万~650万に達するまでの日数は、58日630万~640万に達するまでの日数は、56日620万~630万に達するまでの日数は、49日610万~620万に達するまでの日数は、46日600万~610万に達するまでの日数は、57日590万~600万に達するまでの日数は、51日580万~590万に達するまでの日数は、53日570万~580万に達するまでの日数は、48日560万~570万に達するまでの日数は、43日550万~560万に達するまでの日数は、46日540万~550万に達するまでの日数は、43日530万~540万に達するまでの日数は、41日520万~530万に達するまでの日数は、40日510万~520万に達するまでの日数は、44日500万~510万に達するまでの日数は、48日490万~500万に達するまでの日数は、47日480万~490万に達するまでの日数は、53日470万~480万に達するまでの日数は、56日460万~470万に達するまでの日数は、54日450万~460万に達するまでの日数は、46日440万~450万に達するまでの日数は、48日430万~440万に達するまでの日数は、48日420万~430万に達するまでの日数は、42日410万~420万に達するまでの日数は、47日400万~410万に達するまでの日数は、53日390万~400万に達するまでの日数は、47日380万~390万に達するまでの日数は、48日370万~380万に達するまでの日数は、53日360万~370万に達するまでの日数は、68日350万~360万に達するまでの日数は、57日340万~350万に達するまでの日数は、64日330万~340万に達するまでの日数は、59日320万~330万に達するまでの日数は、51日310万~320万に達するまでの日数は、45日300万~310万に達するまでの日数は、39日290万~300万に達するまでの日数は、38日280万~290万に達するまでの日数は、39日270万~280万に達するまでの日数は、41日260万~270万に達するまでの日数は、60日250万~260万に達するまでの日数は、76日240万~250万に達するまでの日数は、71日230万~240万に達するまでの日数は、64日220万~230万に達するまでの日数は、65日210万~220万に達するまでの日数は、72日200万~210万に達するまでの日数は、77日190万~200万に達するまでの日数は、103日180万~190万に達するまでの日数は、125日170万~180万に達するまでの日数は、139日160万~170万に達するまでの日数は、135日150万~160万に達するまでの日数は、131日140万~150万に達するまでの日数は、107日130万~140万に達するまでの日数は、118日120万~130万に達するまでの日数は、157日110万~120万に達するまでの日数は、182日100万~110万に達するまでの日数は、168日90万~100万に達するまでの日数は、122日80万~90万に達するまでの日数は、211日70万~80万に達するまでの日数は、206日
2024/03/07
コメント(2)
-

グローバルインフォメーション(4171)---24年12月期は最新情報へのニーズ根強く、リポート販売が持ち直す。
グローバルインフォメーション(4171.市場調査)を見ておきます。関連日記まずは、メモ書きです。・買付候補銘柄。・2021年12月期の1株当たり純資産は、前期比が117.1%。・2022年12月期の1株当たり純資産は、前期比が115.4%。・2023年12月期の1株当たり純資産は、前期比が111.7%、3期前比が150.9%。次に、経常利益を見てみる。2018年(平成30年)12月期 3212019年(令和01年)12月期 3422020年(令和02年)12月期 3322021年(令和03年)12月期 553 2022年(令和04年)12月期 648 2023年(令和05年)12月期 565 次に、1株配・配当金総額・配当性向・純資産配当率を見てみる。2019年12月期 16円・40百万円・-%・-%2020年12月期 30円・78百万円・29.4%・5.8%2021年12月期 33円・97百万円・25.1%・5.9%2022年12月期 45円・132百万円・30.3%・6.9%2023年12月期 52円・153百万円・40.0%・7.1%2024年12月期 57円次に、四季報で株主数・外人比率・特定株比率を見てみる。・1,331名<20.12>・0.1%・84.4%・1,502名<21.12>・1.4%・80.0%・1,316名<22.6>・1.7%・79.0%・1,257名<22.12>・3.1%・80.1%・1,367名<23.6>・2.8%・79.5%次に、四季報で時価総額・現金等・有利子負債を見てみる。2021年06月発売号 50.0億円・15.1億円・0億円2022年03月発売号 51.6億円・20.9億円・0億円2022年12月発売号 51.7億円・20.9億円・0億円2023年03月発売号 51.3億円・22.3億円・0億円2023年12月発売号 43.1億円・22.3億円・0億円次に、自己資本比率・1株当たり純資産・のれん・営業CFを見てみる。2020年12月期 70.4%・514.86円・0円・1572021年12月期 70.1%・602.86円・0円・4732022年12月期 74.5%・695.42円・0円・2842023年12月期 78.3%・776.81円・0円・290次に、期末発行済株式数(自己株式を含む)・期末自己株式数を見てみる。2019年12月期末 2,500,000・02020年12月期末 2,625,000・02021年12月期末 2,943,500・412022年12月期末 2,947,500・812023年12月期末 2,947,600・81次に、株価と指標等を見てみる。3月1日の終値は、1,366円予想PERは、10.33倍実績PBRは、1.76倍予想利回りは、4.17%GMOクリック証券によると、・理論株価は、2,210円。(事業価値1,415円+財産価値794円-有利子負債0円)・理論株価比は、61.8%。(現在値÷理論株価)最後に、四季報12月号の記事を見てみる。【決算】12月【設立】1995.1【上場】2020.12【特色】海外の市場調査リポート販売が主力、日本中心に韓台でも展開。製造業等の大手企業が主顧客【連結事業】市場・技術動向に関する情報提供98(22)、他2(-20)【海外】26 <22・12>【好 転】柱の海外調査リポート販売は円安で国内客が買い控え強める。前号比で減益幅拡大。52円配。24年12月期は最新情報へのニーズ根強く、リポート販売が持ち直す。通信機器子会社も上向き。営業益好転。【リポート】HPへの掲載数増やSEO対策、広告等で認知度向上・拡販全力。仕入れ先は米欧に加えインドも拡大。通信機器製販は基板購入先と連携し市場積極開拓。
2024/03/06
コメント(0)
-

ブリッジインターナショナル(7039)---非対面型営業はBPO減速も内製化のシステム開発牽引し着実。
ブリッジインターナショナル(7039.テレマーケティング)を見ておきます。関連日記まずは、メモ書きです。・保有銘柄。・2020年12月期の1株当たり純資産は、前期比が112.1%、3期前比が176.7%。・2021年12月期の1株当たり純資産は、前期比が116.2%、3期前比が144.3%。・2022年12月期の1株当たり純資産は、前期比が119.9%、3期前比が156.2%、5期前比が246.2%。・2023年12月期の1株当たり純資産は、前期比が116.9%、3期前比が162.9%、5期前比が202.3%。次に、経常利益を見てみる。2018年(平成30年)12月期 3312019年(令和01年)12月期 3862020年(令和02年)12月期 4412021年(令和03年)12月期 6492022年(令和04年)12月期 8862023年(令和05年)12月期 916次に、1株配・配当金総額・配当性向・純資産配当率を見てみる。2019年12月期 0円・0百万円・0%・0%2020年12月期 0円・0百万円・0%・0%2021年12月期 0円・0百万円・0%・0%2022年12月期 0円・0百万円・0%・0%2023年12月期 35円・131百万円・20.4%・3.4%2024年12月期 35円次に、四季報で株主数・外人比率・特定株比率を見てみる。・2,858名<21.6>・6.7%・61.5%・2,652名<21.12>・11.2%・60.3%・2,656名<22.6>・9.1%・60.1%・2,375名<22.12>・9.9%・59.1%・2,233名<23.6>・12.5%・61.3%次に、四季報で時価総額・現金等・有利子負債を見てみる。2021年12月発売号 110億円・10億円・2億円2022年03月発売号 66.5億円・17.5億円・2.1億円2022年12月発売号 94.5億円・17.5億円・1.4億円2023年06月発売号 82.0億円・21.6億円・0.9億円2023年12月発売号 61.2億円・21.6億円・0.4億円次に、自己資本比率・1株当たり純資産・のれん・営業CFを見てみる。29年12月期 66.5%・771.52円・0円・2092018年12月期 78.4 %・548.96円・0円・2282019年12月期 80.3%・607.85円・0円・2312020年12月期 79.0%・681.65円・0円・3962021年12月期 71.7%・792.16円・29,272千円・9052022年12月期 76.2%・949.70円・16,262千円・7162023年12月期 80.4%・1,110.35円・3,252千円・677次に、期末発行済株式数(自己株式を含む)・期末自己株式数を見てみる。29年12月期末 1,454,700・02018年12月期末 3,412,600・68(分1→2)2019年12月期末 3,521,400・1442020年12月期末 3,582,200・2172021年12月期末 3,714,200・3102022年12月期末 3,727,000・3892023年12月期末 3,768,600・20,389次に、株価と指標等を見てみる。3月1日の終値は、1,608円予想PERは、9.72倍実績PBRは、1.45倍予想利回りは、2.18%GMOクリック証券によると、・理論株価は、2,321円。(事業価値1,653円+財産価値701円-有利子負債33円)・理論株価比は、69.3%。(現在値÷理論株価)最後に、四季報12月号の記事を見てみる。【決算】12月【設立】2002.1【上場】2018.10【特色】電話やメールで行う非対面型営業(インサイドセールス)で法人営業を支援するサービスを展開【連結事業】インサイドセールス70(12)、研修30(15) <22・12>【連続増益】非対面型営業はBPO減速も内製化のシステム開発牽引し着実。研修好調続く。投資費用吸収。初配。24年12月期は買収分上乗せも影響小さい。DX関連の集合研修が増加。非対面型営業はシステム開発も続伸。単価上げも浸透し利益増。【M&A】24年1月に法人向けデジタルマーケ戦略策定・遂行支援の2BC(東京)を買収のうえ合併。手薄なコンサル強化。
2024/03/05
コメント(0)
-

ヒューリック(3003)---成田空港近隣で大型用地(約13・6万坪)確保。通関や検疫機能など誘致し国際航空貨物に対応した物流施設を開発。
ヒューリック(3003.不動産賃貸)を見ておきます。関連日記まずは、メモ書きです。・買付候補銘柄。・2022年12月期の1株当たり純資産は、前期比が107.9%、3期前比が131.4%、5期前比が158.4%。・2023年12月期の1株当たり純資産は、前期比が111.5%、3期前比が138.2%、5期前比が165.4%。次に、経常利益を見てみる。2018年(平成30年)12月期 72,5302019年(令和01年)12月期 84,6452020年(令和02年)12月期 95,6272021年(令和03年)12月期 109,5812022年(令和04年)12月期 123,2222023年(令和05年)12月期 137,437次に、1株配・配当金総額・配当性向・純資産配当率を見てみる。2021年12月期 39円・28,113百万円・38.5%・4.9%2022年12月期 42円・32,199百万円・40.3%・4.8%2023年12月期 50円・38,332百万円・40.2%・5.2%2024年12月期 52円次に、四季報で株主数・外人比率・特定株比率を見てみる。・158,092名<22.12>・15.5%・48.3%・146,334名<23.6>・15.7%・48.6%次に、四季報で時価総額・現金等・有利子負債を見てみる。2023年03月発売号 8,285億円・1,383億円・14,409億円2023年12月発売号 11,115億円・1,383億円・15,493億円次に、自己資本比率・1株当たり純資産・のれん・営業CFを見てみる。2017年12月期 27.7%・570.02円・4,055百万円・45,7242018年12月期 26.2%・608.49円・4,026百万円・130,9732019年12月期 25.8%・687.01円・3,336百万円・231,1802020年12月期 24.0%・728.31円・3,430百万円・202,3042021年12月期 28.8%・836.89円・3,711百万円・291,7362022年12月期 29.5%・902.70円・4,795百万円・266,1082023年12月期 30.8%・1,006.19円・4,164百万円・270,819次に、期末発行済株式数(自己株式を含む)・期末自己株式数を見てみる。2017年12月期末 663,062,271・4,485,4132018年12月期末 663,062,271・4,486,0962019年12月期末 673,907,735・5,664,4192020年12月期末 673,907,735・5,941,8852021年12月期末 767,907,735・5,802,6932022年12月期末 767,907,735・7,164,2362023年12月期末 767,907,735・6,966,030次に、株価と指標等を見てみる。2月22日の終値は、1,535.5円予想PERは、11.92倍実績PBRは、1.53倍予想利回りは、3.39%GMOクリック証券によると、・理論株価は、850円。(事業価値2,225円+財産価値528円-有利子負債1,903円)・理論株価比は、180.6%。(現在値÷理論株価)最後に、四季報12月号の記事を見てみる。【決算】12月【設立】1931.3【上場】1949.5【特色】旧富士銀行の銀行店舗ビル管理から出発。都区内の駅近接ビル中心に好物件所有、物件多角化へ【連結事業】不動産93(28)、保険1(29)、ホテル・旅館5(-18)、他1(8) <22・12>【連続最高益】不動産売却は好採算案件が貢献、機関投資家の需要堅調。賃貸は空室僅少、ホテルも好調。24年12月期は牽引役の不動産売却が伸長、物件売却増える。賃貸も高稼働。最高純益を更新。連続増配か。【大型物流施設】成田空港近隣で大型用地(約13・6万坪)確保。通関や検疫機能など誘致し国際航空貨物に対応した物流施設を開発。東京都墨田区で大型商業施設を取得。
2024/03/04
コメント(2)
-

2021年6月発行のパプアニューギニアの切手には、イリエワニが描かれている。
画像は、パプアニューギニアが2021年6月に発行した切手。描かれている動物は、イリエワニ。このワニの分布は、インド南東部からベトナム 、フィリピンにかけてのアジア大陸、スンダ列島からニューギニア島、及びオーストラリア北部沿岸、東はカロリン諸島辺りまでの広い範囲に分布する。(ウィキペディアより)もちろん、この切手の発行国、パプアニューギニアにも分布しています。で、この切手の額面は、K6.90と書かれています。これは、6.90パプアニューギニア・キナで、日本円に換算すると、285.95円になります。(1PGK=41.44JPY)
2024/03/04
コメント(0)
-

電算システムHD(4072)---24年12月期は収納代行が競争激化で苦戦だが、情報サービスが請求書作成代行、クラウドサービスなど伸長し牽引。
電算システムHD(4072.システム開発)を見ておきます。関連日記 まずは、メモ書きです。・保有銘柄。・2019年12月期の1株当たり純資産は、前期比が113.9%、3期前比が126.7%、5期前比が141.3%。・2020年12月期の1株当たり純資産は、前期比が132.2%、3期前比が155.5%、5期前比が178.6%。・2021年12月期の1株当たり純資産は、前期比が111.3%、3期前比が167.5%、5期前比が186.3%。・2022年12月期の1株当たり純資産は、前期比が111.7%、3期前比が164.3%、5期前比が193.3%。・2023年12月期の1株当たり純資産は、前期比が107.4%、3期前比が133.5%、5期前比が201.1%。次に、経常利益を見てみる。2017年(平成29年)12月期 1,3362018年(平成30年)12月期 1,7202019年(令和01年)12月期 2,3382020年(令和02年)12月期 2,9162021年(令和03年)12月期 3,2152022年(令和04年)12月期 3,5872023年(令和05年)12月期 4,018次に、1株配・配当金総額・配当性向・純資産配当率を見てみる。20年12月期 13.5円・124百万円・18.6%・2.6%21年12月期 12.5円・113百万円・35.3%・2.2%22年12月期 13.0円・118百万円・28.0%・2.2%23年12月期 14.0円・126百万円・28.1%・2.3%24年12月期 20.0円・179百万円・34.8%・3.0%25年12月期 20.0円・188百万円・31.4%・2.8%26年12月期 22.0円・214百万円・31.2%・2.9%27年12月期 23.0円・224百万円・33.9%・2.9%28年12月期 24.0円・234百万円・31.8%・2.9%29年12月期 25.0円・244百万円・29.7%・2.8%2018年12月期 26.0円・254百万円・24.9%・2.7%2019年12月期 27.0円・264百万円・16.9%・2.6%2020年12月期 28.0円・287百万円・14.7%・2.2%2021年12月期 20.0円・215百万円・10.9%・1.3%2022年12月期 35.0円・377百万円・16.1%・2.0%2023年12月期 37.0円・399百万円・19.7%・2.0%2024年12月期 40.0円次に、四季報で株主数・外人比率・特定株比率を見てみる。・14,119名<19.12>・2.5%・43.6%・14,052名<20.12>・5.6%・42.2%・13,303名<21.12>・5.5%・46.2%・13,720名<22.12>・4.8%・46.9%・12,344名<23.6>・6.1%・45.5%次に、四季報で時価総額・現金等・有利子負債を見てみる。2020年06月発売号 344億円・48億円・16億円2021年03月発売号 335億円・83億円・12億円2022年03月発売号 297億円・89億円・10億円2023年03月発売号 271億円・91億円・14億円2023年12月発売号 300億円・91億円・17億円次に、自己資本比率・1株当たり純資産・のれん・営業CFを見てみる。26年12月期 27.7%・776.68円・0円・1,13027年12月期 26.2%・812.42円・0円・80628年12月期 18.8%・866.60円・445,524千円・1,35429年12月期 28.8%・933.05円・396,347千円・1,2852018年12月期 24.4%・963.54円・347,254千円・1,6712019年12月期 29.0%・1,097.66円・300,331千円・2,4852020年12月期 32.6%・1,450.88円・888,054千円・2,7302021年12月期 33.9%・1,614.29円・1,537百万円・2,5282022年12月期 27.0%・1,803.23円・1,200百万円・1,9072023年12月期 36.1%・1,937.23円・604百万円・5,506次に、期末発行済株式数(自己株式を含む)・期末自己株式数を見てみる。26年12月期末 10,009,800・254,85427年12月期末 10,033,600・349,85428年12月期末 10,040,000・296,55429年12月期末 10,040,000・254,8542018年12月期末 10,040,000・254,9012019年12月期末 10,040,000・254,9012020年12月期末 10,786,000・1,0232021年12月期末 10,784,932・822022年12月期末 10,790,199・9362023年12月期末 10,792,973・171,298次に、株価と指標等を見てみる。2月22日の終値は、2,668円予想PERは、10.16倍実績PBRは、1.38倍予想利回りは、1.5%GMOクリック証券によると、・理論株価は、4,066円。(事業価値2,590円+財産価値1,638円-有利子負債162円)・理論株価比は、65.6%。(現在値÷理論株価)最後に、四季報12月号の記事を見てみる。【決算】12月【設立】2021.7【上場】2021.7【特色】電算システムが21年7月持株会社に移行。グーグル含む情報処理サービスと収納代行が2本柱【連結事業】情報サービス59(5)、収納代行サービス41(8) <22・12>【続 伸】収納代行は新規顧客増。スマホ決済など効率化も寄与。増配。24年12月期は収納代行が競争激化で苦戦だが、情報サービスが請求書作成代行、クラウドサービスなど伸長し牽引。人件費増こなし営業増益。【新ツール】位置情報ビッグデータ活用のツール提供、宅配など円滑化。決済サービスでは消費者が支払い方法・タイミングを決める新機能を追加、回収率など改善図る。
2024/03/03
コメント(0)
-

征野ファンドの運用状況---上がるのは良いが、対TOPIXは厳しいねえ
3月1日時点の征野ファンドの運用状況です。昨年末比は、■征野ファンド・・・・+12.77%。■トピックスは・・・・+14.50%。で、トピックスを下回る成績になっています。(トピックスの終値は、2709.42)組入上位5銘柄は、1.信越化学工業(4063)2.光通信(9435)3.伊藤忠商事(8001)4.トヨタ自動車(7203)5.isTOPIX(1475)で、前週末と同じです。売買の詳細は、こちら。
2024/03/02
コメント(2)
-

清水建設(1803)、LINEヤフー(4689)を全株売付
今週(2/26~3/1)の売買は、1475 isTOPIX 買い増し。6197 ソラスト 買い増し。1803 清水建設 全株売付。4689 LINEヤフー 全株売付。6197 ソラスト 一部売り。上記の他に、買い増しが1銘柄、一部売りが2銘柄あります。清水建設(1803)は、全株売付。3Q決算時に、今期は営業赤字の見通しと発表し、株価軟調。今後しばらくは株価は低迷すると予想し、利益確定とした。LINEヤフー(4689)も、全株売付。株価好調と思ったら、何時の間にか低迷していたりする。過去4年位の株価は、TOPIXに大きく劣後している為、isTOPIX(1475)に乗り換え。
2024/03/02
コメント(0)
-

セグエグループ(3968)---流通株式時価総額増へSBI証券と差金決済型自社株価先渡取引締結し大株主の60万株吸収。
セグエグループ(3968.ネットインフラ構築)を見ておきます。関連日記まずは、メモ書きです。・買付候補銘柄。・2020年12月期の1株当たり純資産は、前期比が114.1%、3期前比が134.3%、5期前比が238.7%。・2021年12月期の1株当たり純資産は、前期比が101.7%、3期前比が130.7%、5期前比が199.3%。・2022年12月期の1株当たり純資産は、前期比が115.3%、3期前比が133.7%、5期前比が157.4%。・2023年12月期の1株当たり純資産は、前期比が109.0%、3期前比が127.7%、5期前比が164.1%。次に、経常利益を見てみる。2018年(平成30年)12月期 4852019年(令和01年)12月期 5542020年(令和02年)12月期 8742021年(令和03年)12月期 6862022年(令和04年)12月期 1,0502023年(令和05年)12月期 1,015次に、1株配・配当金総額・配当性向・純資産配当率を見てみる。2019年12月期 3.33円・114百万円・27.9%・4.4%2020年12月期 5.33円・184百万円・29.2%・6.2%2021年12月期 5.33円・182百万円・40.0%・5.8%2022年12月期 6円・203百万円・27.4%・6.0%2023年12月期 10円・340百万円・51.5%・8.9%2024年12月期 11円次に、四季報で株主数・外人比率・特定株比率を見てみる。・2,925名<20.12>・3.4%・69.8%・3,143名<21.12>・0.8%・67.3%・3,188名<22.6>・1.4%・63.2%・3,000名<22.12>・1.8%・62.9%・2,665名<23.6>・4.0%・63.0%次に、四季報で時価総額・現金等・有利子負債を見てみる。2021年06月発売号 134億円・17億円・1億円2022年03月発売号 63.3億円・13.5億円・5.0億円2022年12月発売号 104億円・13億円・9億円2023年03月発売号 88.9億円・31.0億円・10.9億円2023年12月発売号 106億円・31.0億円・8億円次に、自己資本比率・1株当たり純資産・のれん・営業CFを見てみる。27年12月期 32.5%・921.33円・63,116千円・12 28年12月期 41.7%・1,121.81円・34,908千円・15829年12月期 45.0%・409.39円・6,700千円・6702018年12月期 45.8%・427.77円・62,759千円・4342019年12月期 45.0%・240.97円・116,783千円・7602020年12月期 43.7%・274.91円・92,213千円・1632021年12月期 36.5%・279.50円・68,543千円・△1512022年12月期 32.0%・322.14円・191,968千円・1,1252023年12月期 33.3%・351.00円・161,089千円・1,586次に、期末発行済株式数(自己株式を含む)・期末自己株式数を見てみる。27年12月期末 1,167,000・028年12月期末 1,378,700・029年12月期末 5,668,800・0(分1→2)(分1→2)2018年12月期末 5,729,200・412019年12月期末 11,487,200・236(分1→2)2020年12月期末 11,557,035・127,5892021年12月期末 11,640,235・389,8892022年12月期末 11,687,541 ・500,8892023年12月期末 11,720,791 ・498,060次に、株価と指標等を見てみる。2月22日の終値は、2,060円予想PERは、32.09倍実績PBRは、5.87倍予想利回りは、1.6%GMOクリック証券によると、・理論株価は、869円。(事業価値625円+財産価値329円-有利子負債85円)・理論株価比は、237.1%。(現在値÷理論株価)最後に、四季報12月号の記事を見てみる。【決算】12月【設立】2014.12【上場】2016.12【特色】セキュリティ品の輸入販売とソリューション関連が両輪。SE派遣に強み。自社開発品成長中【連結事業】ソリューションプロダクト64、ソリューションサービス36 <22・12>【増 勢】納期改善もあり製品、サービス売上急増。ただ期末投資費用等重く会社営業益まで減額。大幅増配。24年12月期もDX需要続き受注残豊富なサービス部門が収益底上げ。人材関連費用増吸収。営業益続伸。【上場基準】流通株式時価総額増へSBI証券と差金決済型自社株価先渡取引締結し大株主の60万株吸収。23年末、自社クラウド提供開始、今後3年で20万ユーザー目指す。
2024/03/01
コメント(0)
全41件 (41件中 1-41件目)
1
-
-

- *雑貨*本*おやつ*暮らし*あんな…
- 再販中!【レポ♪】老舗せんべい店「せ…
- (2024-09-28 16:01:57)
-
-
-
- 日記を短歌で綴ろう
- ★☆ 名鉄高架下の草。双子の台風が来…
- (2024-09-28 08:33:11)
-
-
-

- ★「片付け・お掃除・捨てる」の成果★
- 電子レンジでスペイン製の皿が割れた…
- (2024-09-28 12:33:01)
-


