



2020年06月の記事
全3件 (3件中 1-3件目)
1
-
WEIの構成要素(10指標)
WEIの構成要素(10指標) https://www.newyorkfed.org/medialibrary/media/research/staff_reports/sr920.pdf WEIのチャート https://www.newyorkfed.org/research/policy/weekly-economic-index The index is sales-weighted, year-over-year same-store sales growth for a sample of large US general merchandise retailers representing about 9,000 stores. By dollar value, the Index represents over 80% of the "official" retail sales series collected by the Department of Commerce. http://www.redbookresearch.com/ Daily survey of 1500 American adults Sun-Thurs. Index is a 3-day moving average based on five questions about the current state of both the economy and personal finances, whether the economy and personal finances are getting better or worse, and whether the economy is in a recession. https://www.rasmussenreports.com/ Number of claims filed by unemployed individuals after separation from an employer. Data collected from local unemployment offices.https://oui.doleta.gov/unemploy/ Number of continued claims filed by unemployed individuals to receive benefits. Data collected from local unemployment offices.https://oui.doleta.gov/unemploy/ The ASA Staffing Index tracks temporary and contract employment trends. Participants include a stratified panel of small, medium, and large staffing companies that together provide services in virtually all sectors of the industry. They account for about one-third of industry sales offices. https://americanstaffing.net/ Treasury receipts of income and payroll taxes withheld from paychecks. The series is filtered for daily volatility patterns and adjusted for tax law changes. https://taxtracking.com/ Weekly production tonnage provided from 50% of the domestic producers combined with monthly production data for the remainder.https://www.steel.org/industry-data Weekly product supplied minus change in stock of finished gasoline and distillate fuels. This estimates wholesale gasoline + diesel sales to retailers and large end users (e.g., UPS). Published by the U.S. Energy Information Administration in the Weekly Petroleum Status Report.https://www.eia.gov/petroleum/supply/weekly/ Total carloads and intermodal units reported by railroad companies to the Association of American Railroads https://www.aar.org/data- center/ Total output for U.S. (excluding Alaska and Hawaii) investor-owned electric companies. https://www.eei.org/
Jun 16, 2020
コメント(0)
-
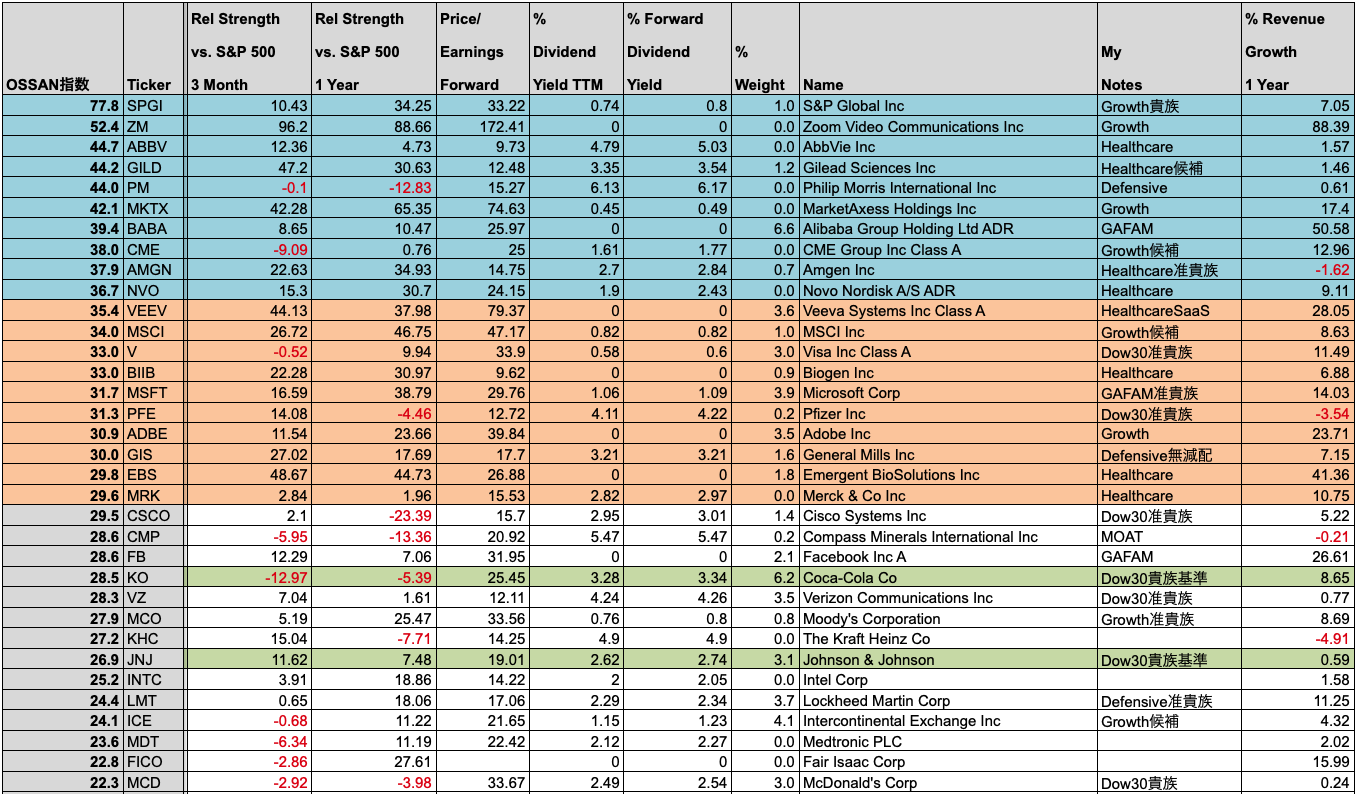
こんな指標をつくってみました
この5つの指標をミックスして、複数の項目に秀でているものが選ばれるように指標を作って見ました(Ossan指数)、、、、だいたいGrowthが6割、高配当が4割くらい選ばれるようです「オーショネシーのグロース+バリューの混合戦略」
Jun 8, 2020
コメント(0)
-
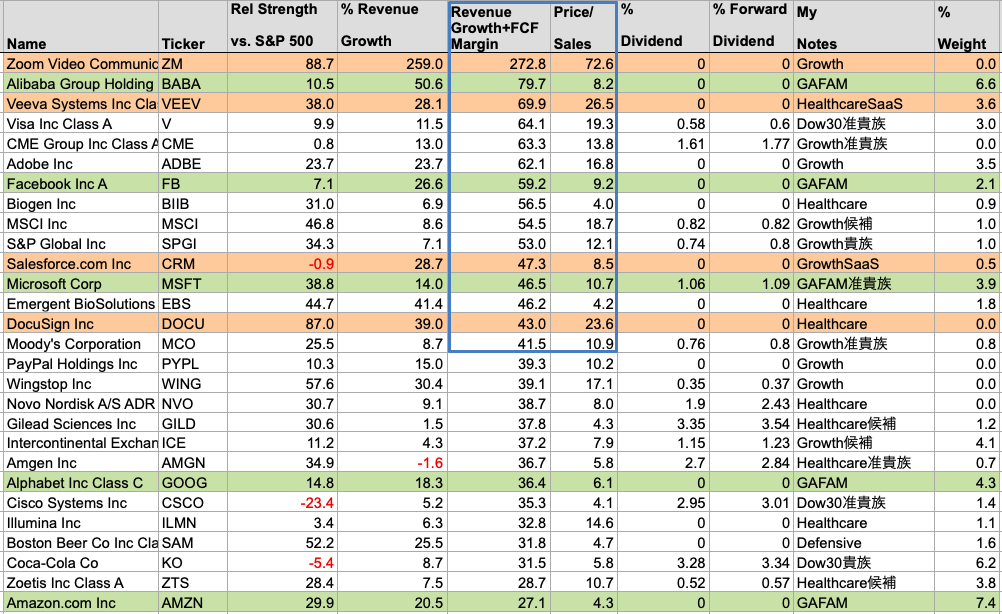
売上成長率+FCF Margin>40%という視点から
コロナの第1波は終わったと米国のマーケットは沸いてますが、人々の行動を観察すれば遠からず第2波が来てしまう予感がしますこれだけ景気が悪いのに、マーケットの勢いに任せて投資をするのもなあと考えて「コロナ6人衆(春山さん命名)」のZMとDOCUから金曜日にいったん身を引いて、中国銘柄のBABAなどに振り向けましたZMとDOCUを売上成長率+FCF Margin>40%という視点から、持ち株の半分くらいと比較してみました資料はモーニングスターからですが、オリジナルデータではなく、例えばZMなどは年度末までの予測される売上成長率に置き換えて計算しています。なお配当貴族は25年以上、准貴族は10年以上、候補は5年以上の連続増配という意味になります。こちらを参考しました、、、ペコhttps://www.americabu.com/saas成長性をどう見るかで大きく左右されるわけですが、、、SaaSの40%ルールとは、ほとんどの場合は売上成長率+フリーキャッシュフロー・マージン=40%以上が事業の強さの指標である、、またRelative Strengthはオーショネシーの「ウオール街に勝つ法則」によれば、株価の先行きの明るさを示す「唯一の指標」としていますが、、、、これをグロース戦略として、有名な大型株から配当利回りの高い銘柄選ぶバリュー戦略と混合すると、リスクを減らし、リターンも満足できるものが得られるとしています1)一貫して市場をアウトパフォームするための唯一の成長変数は、レラティブ・ストレングスである。2)人気絶頂の銘柄を高PERで買うのは最悪の戦略だ。3)有名な大型株から配当利回りの高い銘柄を選んで投資すれば、S&P500の4倍の成果を得られる。PSRは業種別に見ないといけないのですが、例えばボストンビールは4.7で、コカコーラは5.8ですが、これはビールの方が景気に左右されやすいという面も加味されていると思います。売上成長率+FCF Marginでは両社とも同じですが、ボストンビールでは売上成長率が25%あっての数値であり、FCF Marginがコカコーラ に著しく劣っているということがわかります。また配当利回りはボストンビールが無配に対して、コカコーラは10年米国債利回り+2%以上となっていますコロナにより最悪の経済状況の中で、お金がジャブジャブに供給されて状況で何が正解かなどと言えるわけではありませんが、あとで自分の行動を振り返ってみるために、資料をここに残しておこうと思いました
Jun 7, 2020
コメント(0)
全3件 (3件中 1-3件目)
1


-
-

- お買い物マラソンでほしい!買った!…
- 楽天マラソンでアクセサリーのサイズ…
- (2026-08-02 20:10:03)
-
-
-

- みんなのレビュー
- ビリビリに破れた椅子の座面をセルフ…
- (2026-08-02 09:18:05)
-
-
-

- たわごと
- この暑さいつまで続くでしょう?行事…
- (2026-08-02 09:49:55)
-


