

The home page is where you create and access all your Looker Studio assets: reports, data sources, and explorations. This page helps you find your way around Looker Studio's three primary user interfaces.
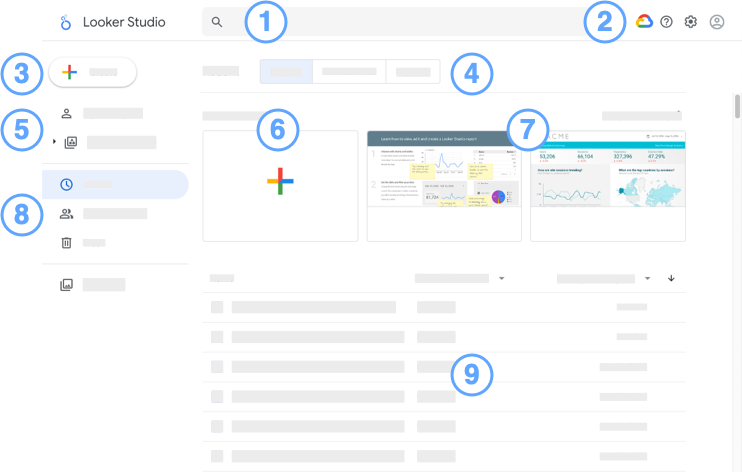
Looker Studio home page legend:
-
 Search Looker Studioinput box: Find Looker Studio assets quickly.
 -
Options:
 Google Cloud Platformicon: Access the Google Cloud console.
 Help optionsicon: Get help and feedback.
 User settingsicon: View user settings.
 Google Accounticon: Manage your Google Account.
-
 Createbutton: Create a new asset (report, data source, or exploration).
 -
Asset type tabs. Display reports, data sources, or explorations.
-
Workspaces (Looker Studio).
-
Create a new report.
-
Tutorial and template reports.
-
Filter the asset list to show recent assets, including those owned by you, those shared with you, and any assets in the trash.
-
Asset list. Click an asset to view it.
- On the right, use an asset's
 overflow menu to share, rename, or remove it.
 - Sort assets by name, owner, or date.
- On the right, use an asset's
Find your way around the report editor
To edit a report, locate it in the asset list; view the asset; and then, in the upper right, click![]() EDIT.
EDIT.
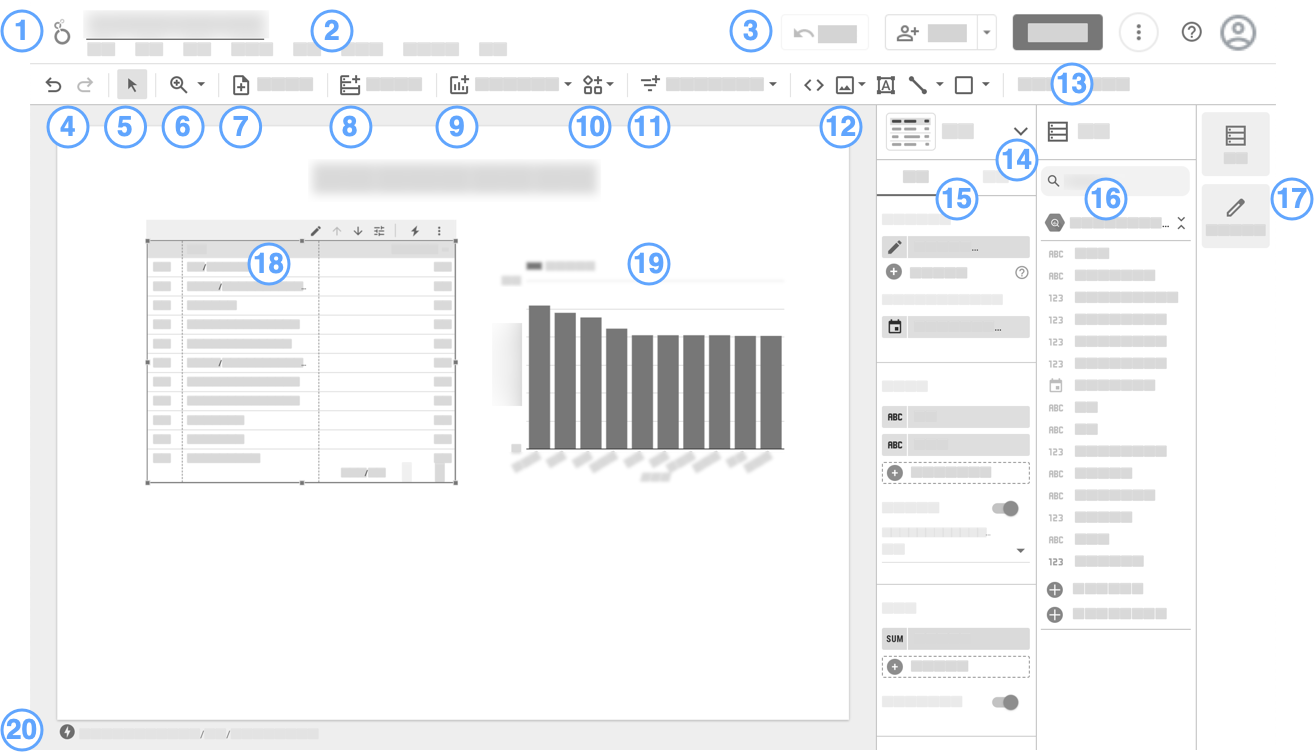
Report editor legend:
- Logo and report name. Click the logo to return to the Looker Studio home page.
- Menu bar. Many menu functions can also be accessed by right-clicking a component.
- (From left to right)
 Reset. Restore the report to its default settings.
 Share
Share
 View. Switch between edit and view mode
.
View. Switch between edit and view mode
.- More options
- Help.
- Manage your Google Account.
- Undo | Redo

 .
.  Selection mode.
 Zoom.
Zoom. Add page
.
Add page
. Add data
.
Add data
. Add a chart
.
Add a chart
. Add a community visualization
.
Add a community visualization
. Add interactive viewer controls
.
Add interactive viewer controls
. Add text, images, lines, and shapes
.
Add text, images, lines, and shapes
.- Open the Theme and layout panel.
- Visualization picker. Lets you change the selected chart's visualization type.
- Properties panel . Lets you set up and stylize the selected component.
- Data panel. Access all the data sources that are used in the report.
- Panel manager. Hide or show the Propertiesand Datapanels.
- Table visualization, selected.
- A bar chart, not selected.
- BigQuery BI engine indicator.
Find your way around the data source editor
To edit a data source used by your report, follow these steps:
- Edit your report.
- In the menus, select Resource > Manage added data sources.
- Locate the data source in the list and then click Edit
 .
.
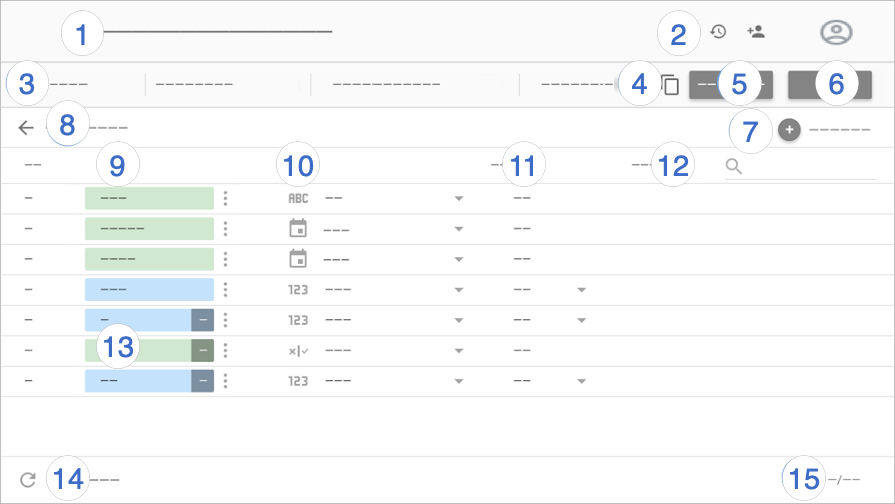
Data source editor legend:
- Data source name. Click to change the name.
- Version history
. View and
 restore previous versions of the data source.
Next to version history is the Share
button, which lets you share this data source with other people.
restore previous versions of the data source.
Next to version history is the Share
button, which lets you share this data source with other people. - Data source options:
- Data credentials . Determines who can view the data that is provided by this data source.
- Data freshness .Balances data updates with report performance.
- Community visualizations access .Allows this data source to provide data to community visualizations.
- Field editing in reports . Lets report editors change field names and aggregations, apply analytical functions, and set field display options without needing to edit the data source.
- Make a copy of this data source.
- Create report . Create a new report from this data source.
- Explore . Create a new exploration from this data source.
- Add a field . Create a calculated field, add a custom bin, or add a custom group.
-
Edit connection . The data source owner can reconnect the data source.
Filter by email address . Add row-level security to your data.
-
Fields . Dimensions appear in green chips, metrics in blue chips, and parameters in purple chips. Click a field to give it a new name. To perform other field actions, click
More. -
Field type . Determines the kind of data that is contained in the field. Click the drop-down menu to change the type.
-
Aggregation . Determines how the field is summarized. Click the drop-down menu to change the aggregation. Fields with AUTO aggregation can't be changed.
-
Description. Add a description to any field. For Looker and Search Ads 360 connections, the description is automatically populated from the data source.
When the Show field descriptions style option is enabled for table charts, users can view the field description in a tooltip. Show field descriptionsis automatically enabled for charts that are connected to a Looker or Search Ads 360 data source.
-
Calculated fields , custom bins , and custom groups . Click fxto edit the field formula.
-
Refresh fields . Click to update the data source with any structural changes that were made to the underlying dataset.
-
Field count. Displays the number of fields in the data source.