
This page shows examples of patterns that you might see in a Key Visualizer heatmap. These patterns can help you troubleshoot specific performance issues.
Evenly distributed usage
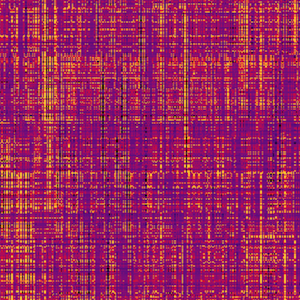
If a heatmap shows a fine-grained mix of dark and bright colors, then reads and writes are evenly distributed throughout the database. This heatmap likely represents an effective usage pattern for Cloud Firestore .
Sequential keys
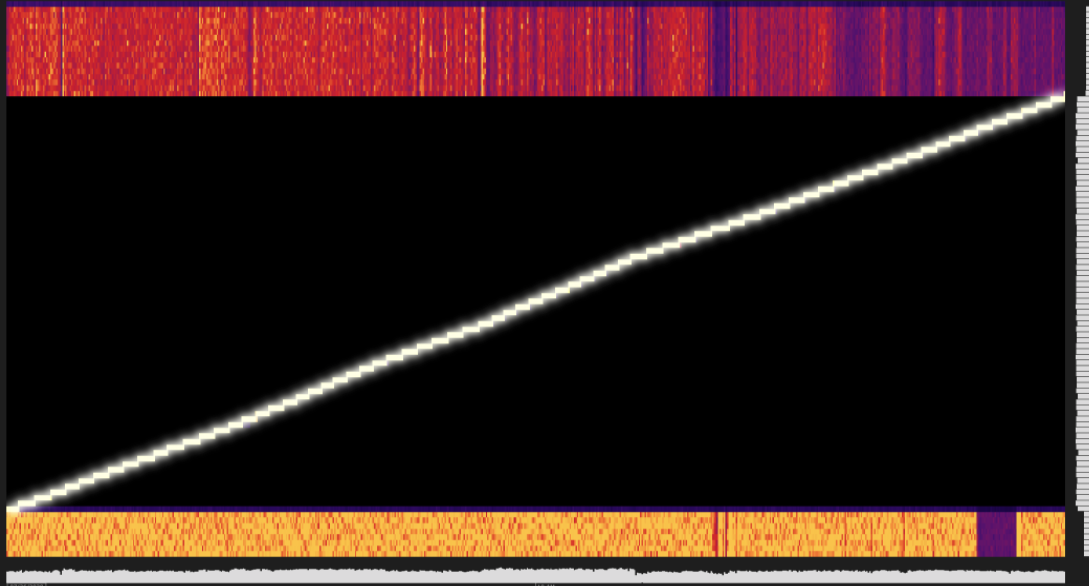
A heatmap with a single bright diagonal line can indicate a database that uses strictly increasing or decreasing keys. Sequential keys are an anti-pattern that can create hotspots. To learn more about hotspots, see the [best practices page][hot-spots].
When hotspotting, you might observe corresponding elevated latencies
when you compare a Ops/s
metric with a latency metric.
Sudden traffic increase

A heatmap with a key range that suddenly changes from dark to bright indicates
a sudden spike in load. If Ops
traffic increases faster than Cloud Firestore
can auto-scale resources, you might see
corresponding elevated latency
metrics.
What's next
- Learn how to get started with Key Visualizer .
- Find out how to explore a heatmap in detail .
- Read about the metrics you can view in a heatmap .
- Learn about index key patterns