

PR
令和維新
2004年4月から企業を離れ、コンサルタントや情報起業を試行しなが ら、失われた20年を取り戻し、日本再生をめざす私の歩みをみて一人でも多くの後継者が出てくれることを祈りつつ友達から紹 介されたこのホームページの更新を続け、これまでの活動の記録と今やビッグデータ、AI,、IOT,ブロックチェーン、仮想通貨の時代になってしまいましたが、私の現状認識と関連技術を紹介していきたい。
デフレーションの強制継続
イーサリアムの長期戦:なぜ2026年がすべてを変える年になり得るのか(Ethereum's Long Game: Why 2026 Could Be the Year That Changes Everything)
テクニカル・ドキュメンテーションのためのコンテンツ・デザイン実践の構築(Building a Content Design Practice for Technical Documentation
(1)トークン化は注目の話題である。しかし、それを現実世界で機能させることが最も難しい部分だ(Tokenization Is a Hot Topic. Making It Work in the Real World Is the Hard Part.)
先端技術情報20260726
「マジ面倒くさいなあ」日本を衰退させた愚者たち
市場フェーズの解説:蓄積、拡大、分配、リセット(Market Phases Explained: Accumulation, Expansion, Distribution, Reset)
(2)テクニカルドキュメンテーションのためのコンテンツデザイン実践の構築(Building a Content Design Practice for Technical Documentation)
先端技術情報20260725
Comments
E851形 キハ81系特…
 New!
GKenさん
New!
GKenさん2026年7月27日の…
New!
藻緯羅さん源氏物語〔35帖 柏木…
New!
USM1さんハープコンサート in… 47弦の詩人さん
Category
カテゴリ未分類
(112)連絡
(24)交流会
(27)セミナー
(29)参考情報
(138)オフ会
(36)on-line報告会
(13)翻訳ビジネス
(8)情報開発
(270)ビッグデータ
(88)ブロックチェーン
(248)人工知能
(534)IOT
(307)仮想通貨
(866)コンテンツ
(127)政治経済
(1944)先端技術
(962)DITA
(52)テレワーク
(28)UX
(0)文書管理
(8)テクニカルライテイング
(23)学習
(9)訓練
(1)XMLソリューション
(3)メタバース
(101)Web3
(68)投資
(191)IoT
(34)投資信託
(1)ビットコイン
(786)イーサリアム
(163)NFT
(41)オンライン
(0)受動収入
(14)ソーシャルメデイア
(0)DAO
(2)DeFi
(79)暗号通貨
(168)トークノミクス
(22)アルトコイン
(229)空中投下
(16)スマート契約
(4)ステーブルコイン
(42)金
(5)生成AI
(5)SCM
(4)ウオレット
(9)不労所得
(58)セキュリテイ
(4)ミームコイン
(50)CBDC
(5)PoS
(3)PoW
(1)ETF
(15)仮想通貨ETF
(1)予言
(7)裁定取引
(1)GameFi
(5)マイニング
(9)RWA
(23)DePIN
(22)SWFT
(1)WLFI
(1)アービトラージ
(7)XRP
(67)大統領選
(4)BCH
(1)取引ボット
(17)トレーデイング
(52)不動産
(1)詐欺
(4)貿易戦争
(1)医療
(1)金融
(2)TEZOS
(1)CARDANO
(2)カルダーノ
(3)ステーキング
(5)チェーンリンク
(1)開発
(0)HEDERA
(3)スマートマネー
(0)流動性
(0)AIエージェント
(19)401k
(1)国際送金
(1)solano
(1)AI
(1)暗号資産
(74)機関投資家
(5)量子コンピューター
(4)AIエージェント
(1)ドキュメンテーション
(2)AIトレーデイング
(1)Keyword Search
Freepage List


Shopping List
ステップ4:繰り返し観察する
Technical analysis isn’t about perfection; it’s about consistent observation.
テクニカル分析は完璧を目指すものではなく、継続的な観察が重要です。
If you use Pump Parade daily, reviewing indicators, noting trends, and observing how price interacts with signals, over time, you’ll notice patterns that aren’t obvious from price alone.
Pump Parade を毎日使って、インジケーターを確認し、トレンドを記録し、価格がシグナルとどう反応するかを観察していけば、やがて価格だけでは見えないパターンに気づくようになります。
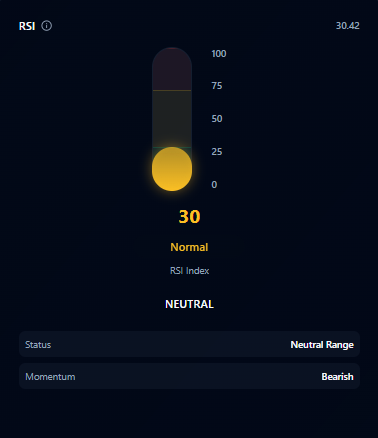
- RSI extremes rarely cause immediate reversals without trend />
- Support and resistance levels can act as reliable guides for stop-loss placement
サポートとレジスタンスの水準は、損切りラインの設定において信頼できる指標になる
Use the tool consistently and you will learn to read the market in a structured, repeatable way
, rather than guessing or reacting emotionally.
このツールを継続的に使うことで、感情に流されることなく、構造的で再現性のある方法で市場を読み解けるようになります。
Start making better crypto decisions. Visit Pump Parade and run free, AI-powered technical analyses on more than 1,000 cryptocurrencies
.
より良い仮想通貨の意思決定を始めましょう。
Pump Parade
を訪れて、
1,000
種類以上の暗号資産に対応した無料の
AI
テクニカル分析を体験してみてください。

Tips for Maximizing Pump Parade’s Technical Analysis Tool
Pump Parade
のテクニカル分析ツールを最大限に活用する爲のヒント
Using the technical analysis tool effectively isn’t just about knowing what each indicator does. The real power comes from how you combine and interpret the signals over time
.
テクニカル分析ツールを効果的に使うというのは、各インジケーターが何をするかを知ることだけではありません。
Technical indicators are tools, notguarantees, and their insights are strongest when viewed together in context. A single metric can be misleading, but a combination reveals trends, momentum, and risk in a way that is actionable and understandable.
テクニカル指標はあくまでツールであり、保証ではありません。そして、それらの洞察は文脈の中でまとめて見るときに最も強力になります。

Here are some key strategies I’ve learned while building and using the engine:
私がこのエンジンを構築し、使ってきた中で学んだいくつかの重要な戦略はこちら。:
- Focus on combinations
: Don’t make decisions from a single indicator. Look for agreement across RSI, slope, MA, and MACD.
組み合わせに注目すること: 単一のインジケーターだけで判断しないでください。 RSI 、傾き、移動平均、 MACD の間で一致があるかを探しましょう。
- Always consider volatility
: High-risk moves need stricter entry/exit discipline.
常に乱高下を考慮すること: リスクの高い動きには、より厳格な参入/退出の規律が必要です。
- Use support/resistance dynamically
: Treat them as zones, not exact numbers.
サポート/レジスタンスを動的に使うこと : それらを正確な数値ではなく、ゾーンとして扱いましょう。
- Watch trends over time
: One snapshot is rarely enough; observe how slope and MA evolve.
時間をかけてトレンドを観察すること: 一度のスナップショットでは不十分なことが多いです。傾きや移動平均がどう変化していくかを観察しましょう。
- Stay consistent
: Daily review builds intuition and reinforces patterns without emotion. Come back every day to adjust your strategy and make better, informed decisions.
一貫性を保つこと: 日々のレビューが直感を育て、感情に流されずにパターンを強化します。毎日戻ってきて戦略を調整し、より良く、情報に基づいた判断を下しましょう。
These practices turn Pump Parade’
s technical analysis from a set of numbers into a framework for understanding the market. Integrating these strategies into your daily workflow will help you see patterns more clearly, spotting potential opportunities earlier, and making decisions with confidence rather than guesswork.
これらの実践によって、
Pump Parade
のテクニカル分析は単なる数値の集まりから、市場を理解するための枠組みへと変わります。これらの戦略を日々の作業に取り入れることで、パターンがより明確に見えるようになり、潜在的なチャンスを早期に見つけ、自信を持って判断できるようになります。
Over time, this approach transforms technical analysis from a theoretical exercise into a practical, disciplined method for navigating crypto markets.
時間が経つにつれて、このアプローチはテクニカル分析を理論的な練習から、実践的で規律ある暗号資産市場のナビゲーション手法へと変えてくれます。
Pump Parade’s AI Technical Analysis tool is free to use and open for everyone. Click here to get started
.
Pump Parade
の
AI
テクニカル分析ツールは、誰でも無料で利用できます。始めるにはこちらをクリックしてください。
What to Look Out for When Using AI Technical Analysis
AI
によるテクニカル分析を使うときに注意すべきこと
Technical analysis is not just about running calculations. Crypto moves fast, trends are messy, and indicators can mislead if taken at face value.
テクニカル分析は、単に計算を実行することだけではありません。暗号資産市場は動きが速く、トレンドは複雑で、インジケーターも額面通りに受け取ると誤解を招くことがあります。


Over time, working with the technical
analysis engine taught me lessons that no chart or textbook could. These are
the insights I wish I had known from day one, and the ones I would pass on to
anyone using technical analysis in crypto:
時間をかけてテクニカル分析エンジンと向き合う中で、どんなチャートや教科書でも教えてくれなかった教訓を学びました。これらは、最初の日から知っておきたかった洞察であり、暗号資産でテクニカル分析を使うすべての人に伝えたいことです。
- Never rely on a single indicator
: MACD alone doesn’t guarantee trend reversal. RSI alone doesn’t mean buy. Use the combination.
単一のインジケーターに頼らないこと: MACD だけではトレンド転換を保証しません。 RSI だけでは「買い」とは限りません。組み合わせて使いましょう。
- Volatility changes everything
: A high-volatility token with bullish indicators might still swing wildly. Risk assessment is as important as trend assessment.
乱高下はすべてを変える: 強気のインジケーターが出ていても、乱高下の大きいトークンは激しく上下する可能性があります。リスク評価はトレンド評価と同じくらい重要です。
- Trends can persist longer than expected
: Overbought RSI doesn’t always mean immediate correction. Look at slopes and moving averages to gauge trend strength.
トレンドは予想以上に長く続くことがある: RSI が買われすぎを示していても、すぐに調整が来るとは限りません。傾きや移動平均を見て、トレンドの強さを判断しましょう。
- Support and resistance are contextual
: A level that held for a few days might break under sudden volume. Adaptive windows work better than static calculations.
サポートとレジスタンスは文脈次第: 数日間機能していた価格帯も、急な出来高で簡単に破られることがあります。静的な計算よりも、柔軟に調整する見方の方が有効です。
The good news is that, instead of relying on memory or gut feeling, Pump Parade
’s system flags them automatically.
良い知らせは、記憶や直感に頼る代わりに、
Pump Parade
のシステムがそれらを自動で検出してくれるということです。
Over time, it becomes a teacher as much as a tool.
時間が経つにつれて、それはツールと同じくらい教師にもなります。
Click here and start analyzing over 1,000 tokens with Pump Parade’s AI Technical Analysis tool
!
こちらをクリックして、
Pump Parade
の
AI
テクニカル分析ツールで
1,000
以上のトークンを分析し始めましょう!
The Daily Impact
日々の影響
After a few months of using the engine daily, the change was profound.
このエンジンを毎日使い続けて数か月後、その変化は重大でした。
Decisions became calmer, more deliberate. I stopped chasing hype. I could explain why I entered or avoided a position. The metrics gave me confidence without overconfidence:
判断はより落ち着いて、慎重になりました。話題性だけを追いかけるのをやめました。なぜポジションを取ったのか、あるいは見送ったのかを説明できるようになりました。指標は、過信ではなく自信を与えてくれました。
- I knew when a token was genuinely oversold instead of just “cheap.”
単に「安い」のではなく、本当に売られすぎているトークンが分かりました。
- I could anticipate where the price might hit resistance or support.
価格がどこで上限や下限にぶつかるかを予測できるようになりました。
- I had quantitative insight into trend momentum and risk before making moves.
行動を起こす前に、トレンドの勢いやリスクを定量的に把握できるようになりました。
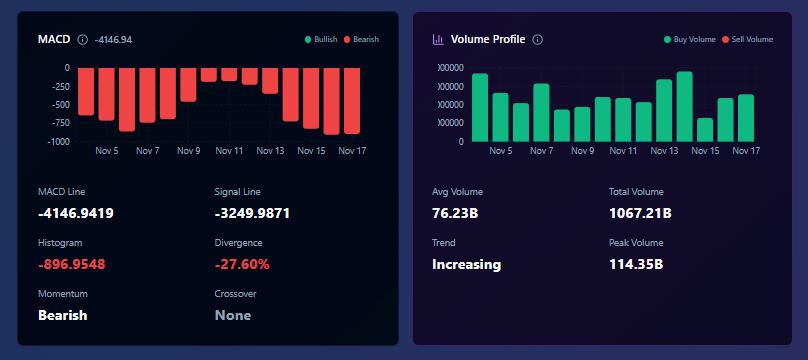
It also revealed the nuances
that casual traders often miss. For example: a token might look bullish on price alone, but MACD divergence or flattening MA slopes suggested momentum was
weakening. Those subtle signals made the difference between a small win and a loss.
また、カジュアルなトレーダーが見落としがちな 微妙な違い
も明らかにしてくれました。たとえば、価格だけを見ると強気に見えるトークンでも、
MACD
のダイバージェンスや移動平均線の傾きの平坦化が、勢いの弱まりを示していることがあります。そうした微妙なシグナルが、小さな勝ちと損失の分かれ目になるのです。
Some Final Tips Before You Start With Pump Parade’sTechnical Analysis
Pump Parade
のテクニカル分析を始める前に伝えておきたい、いくつかの最後のヒント
If you’re thinking about applying technicalanalysis in crypto, here’s what I’d suggest based on building and using this engine:
もし暗号資産でテクニカル分析を使おうと考えているなら、このエンジンを構築・活用してきた経験から、次のことをおすすめします。
- Combine indicators thoughtfully
: Look at RSI, MACD, moving averages, slope, and volatility together. Treat each as a piece of a bigger picture.
インジケーターは慎重に組み合わせること: RSI 、 MACD 、移動平均、傾き、ボラティリティを一緒に見ましょう。それぞれをより大きな全体像の一部として扱ってください。
- Use context, not absolutes
: Indicators are guides, not guarantees. Overbought doesn’t always mean sell; oversold doesn’t always mean buy.
絶対的ではなく、文脈で判断すること: インジケーターは保証ではなくガイドです。買われすぎ=即売り、売られすぎ=即買い、とは限りません。
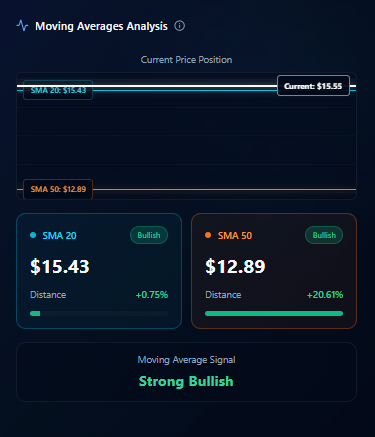
- Track trend strength, not just direction
: The slope of moving averages or linear regression is more informative than a simple up/down signal.
方向だけでなく、トレンドの強さを追うこと: 移動平均や線形回帰の傾きは、単なる上昇/下降のシグナルよりも多くを教えてくれます。
- Integrate risk metrics
: Volatility should always influence your decisions. High-risk tokens need stricter discipline.
リスク指標を組み込むこと: ボラティリティは常に意思決定に影響を与えるべきです。リスクの高いトークンには、より厳格な規律が必要です。
- Visualize patterns
: Numbers are helpful, but charts make signals immediately actionable.
パターンを視覚化すること: 数値も役立ちますが、チャートはシグナルをすぐに行動に移せる形で見せてくれます。
- Stay consistent
: Build a repeatable process. That’s how you remove emotion from trading.
一貫性を保つこと: 繰り返し可能なプロセスを構築しましょう。それが、トレードから感情を排除する方法です。
Closing Thoughts
最後に思うこと
I went from distrusting technical analysis to relying on it as the backbone of my trading workflow. Not because it predicts the future, but because it reveals the present in a structured,
interpretable way.
私は、テクニカル分析を信用していなかったところから、それを自分のトレード作業の流れの屋台骨として頼るようになりました。それは未来を予測するからではなく、今を構造的かつ解釈可能な形で明らかにしてくれるからです。
Pump Parade’s crypto AI engine
taught me that the value of technical analysis isn’t in mystical patterns or lucky guesses. It’s in consistency, clarity, and context
.
Pump Parade
の暗号資産
AI
エンジンが教えてくれたのは、テクニカル分析の価値は神秘的なパターンや運任せの予想にあるのではない、ということです。その価値は、 一貫性、明確さ、そして文脈
にあります。
Once you can see the indicators working together reliably, the market stops feeling random and starts making sense.
インジケーターが信頼できる形で連携しているのが見えてくると、市場はランダムに感じられなくなり、意味を持ち始めます。
And that’s the point: technical analysis doesn’t replace judgment. It sharpens it. It doesn’t promise wins. It ensures you’re aware
.
そして、それこそが本質です。テクニカル分析は判断力の代わりになるものではなく、それを研ぎ澄ますものです。勝利を約束するものではありませんが、 気づき
を与えてくれます。
For anyone looking to approach crypto with more clarity, the lesson is simple: measure, visualize, contextualize, and let the data guide your decisions, not your gut.
より明確な視点で暗号資産に取り組みたい人にとって、学ぶべき教訓はシンプルです:測定し、視覚化し、文脈を読み取り、直感ではなくデータに判断を委ねましょう。
Cryptocurrency
暗号通貨
AI
人工知能
Technical Analysis
テクニカル分析
Crypto Trading
仮想通貨トレーデイング
Blockchain
ブロックチェーン
Written by Pump Parade
文責:パンプパレード
Crypto screening tool with real-time data and sentiment tracker. Find the best altcoins, memecoins, and crypto gems. https://pumpparade.com/
https://pumpparade.com/
インターネット・コンピュータランキング
==============================
ネットサービスランキング
==============================
![[商品価格に関しましては、リンクが作成された時点と現時点で情報が変更されている場合がございます。]](https://hbb.afl.rakuten.co.jp/hgb/4f090f21.289310e1.4f090f23.6f4d2551/?me_id=1220528&item_id=10000332&pc=https%3A%2F%2Fthumbnail.image.rakuten.co.jp%2F%400_mall%2Fomosan%2Fcabinet%2F11749111%2Fomotenashi%2Fomotenashi.jpg%3F_ex%3D240x240&s=240x240&t=picttext "[商品価格に関しましては、リンクが作成された時点と現時点で情報が変更されている場合がございます。]")
\SS期間ポイント5倍※要エントリー★さらに12/10限定+5倍/おせち 2026 予約 千賀屋謹製 『おもてなし』 和風 3段重 57品 4人前 5人前 8.5寸 送料無料 お節 千賀屋 御節 おせち料理 2025 お正月 御節料理 三段重
価格:16,900円(税込、送料無料) (2025/12/9時点)

![[商品価格に関しましては、リンクが作成された時点と現時点で情報が変更されている場合がございます。]](https://hbb.afl.rakuten.co.jp/hgb/1ff2bb79.191d27ac.1ff2bb7a.979bba0e/?me_id=1206032&item_id=14577484&pc=https%3A%2F%2Fthumbnail.image.rakuten.co.jp%2F%400_mall%2Fjism%2Fcabinet%2F0528%2F4529327929000.jpg%3F_ex%3D240x240&s=240x240&t=picttext "[商品価格に関しましては、リンクが作成された時点と現時点で情報が変更されている場合がございます。]")
Titan Army|タイタンアーミー ゲーミング液晶ディスプレイ(27型/FAST IPS/WQHD 2560×1440/320Hz/1ms/HDR1000/HDMI2.1/DP1.4/PBP・PIP対応/VESA)(ブラック) P275MS+
価格:62,800円(税込、送料別) (2025/8/1時点)
![[商品価格に関しましては、リンクが作成された時点と現時点で情報が変更されている場合がございます。]](https://hbb.afl.rakuten.co.jp/hgb/4ae27d5e.21a3ae23.4ae27d5f.b3ad3ffe/?me_id=1430642&item_id=10000096&pc=https%3A%2F%2Fthumbnail.image.rakuten.co.jp%2F%400_mall%2Fvoguevortex%2Fcabinet%2F11366713%2F11366934%2F11367029%2Fztr.jpg%3F_ex%3D240x240&s=240x240&t=picttext "[商品価格に関しましては、リンクが作成された時点と現時点で情報が変更されている場合がございます。]")
![[商品価格に関しましては、リンクが作成された時点と現時点で情報が変更されている場合がございます。]](https://hbb.afl.rakuten.co.jp/hgb/4ae27bcc.ba8aeb41.4ae27bcd.9a8f4b71/?me_id=1425036&item_id=10000049&pc=https%3A%2F%2Fthumbnail.image.rakuten.co.jp%2F%400_mall%2Fgmktecdirect%2Fcabinet%2F10269465%2Fcoupon%2Fk8plus-samune-0331.jpg%3F_ex%3D240x240&s=240x240&t=picttext "[商品価格に関しましては、リンクが作成された時点と現時点で情報が変更されている場合がございます。]")
![[商品価格に関しましては、リンクが作成された時点と現時点で情報が変更されている場合がございます。]](https://hbb.afl.rakuten.co.jp/hgb/4ae27418.1ee40ea5.4ae27419.d4988bf9/?me_id=1413163&item_id=10000379&pc=https%3A%2F%2Fthumbnail.image.rakuten.co.jp%2F%400_mall%2Fexception5251%2Fcabinet%2F11219683%2F11219688%2Fdiscount75%2Ff-00003.jpg%3F_ex%3D240x240&s=240x240&t=picttext "[商品価格に関しましては、リンクが作成された時点と現時点で情報が変更されている場合がございます。]")
![[商品価格に関しましては、リンクが作成された時点と現時点で情報が変更されている場合がございます。]](https://hbb.afl.rakuten.co.jp/hgb/49d5faeb.86973ea4.49d5faec.1dd8f601/?me_id=1427535&item_id=10000020&pc=https%3A%2F%2Fthumbnail.image.rakuten.co.jp%2F%400_mall%2Flakshmistore%2Fcabinet%2F10865184%2Fimgrc0088556619.jpg%3F_ex%3D240x240&s=240x240&t=picttext "[商品価格に関しましては、リンクが作成された時点と現時点で情報が変更されている場合がございます。]")
![[商品価格に関しましては、リンクが作成された時点と現時点で情報が変更されている場合がございます。]](https://hbb.afl.rakuten.co.jp/hgb/3c5b7654.02273dfa.3c5b7655.0ebf4fa0/?me_id=1396705&item_id=10001358&pc=https%3A%2F%2Fthumbnail.image.rakuten.co.jp%2F%400_mall%2Fkrdirect%2Fcabinet%2Fnewpc%2Fn150_01_256g_rd.jpg%3F_ex%3D240x240&s=240x240&t=picttext "[商品価格に関しましては、リンクが作成された時点と現時点で情報が変更されている場合がございます。]")
![[商品価格に関しましては、リンクが作成された時点と現時点で情報が変更されている場合がございます。]](https://hbb.afl.rakuten.co.jp/hgb/4cb237fd.80b5f2c4.4cb237fe.9a40616a/?me_id=1360411&item_id=10000102&pc=https%3A%2F%2Fthumbnail.image.rakuten.co.jp%2F%400_mall%2Ff464686-osaki%2Fcabinet%2F08433205%2Fimgrc0109948245.jpg%3F_ex%3D240x240&s=240x240&t=picttext "[商品価格に関しましては、リンクが作成された時点と現時点で情報が変更されている場合がございます。]")
![[商品価格に関しましては、リンクが作成された時点と現時点で情報が変更されている場合がございます。]](https://hbb.afl.rakuten.co.jp/hgb/48b50de1.c719ad98.48b50de2.1452644e/?me_id=1306273&item_id=10024122&pc=https%3A%2F%2Fthumbnail.image.rakuten.co.jp%2F%400_mall%2Fsoukaidrink%2Fcabinet%2F920%2F4901777440920.jpg%3F_ex%3D240x240&s=240x240&t=picttext "[商品価格に関しましては、リンクが作成された時点と現時点で情報が変更されている場合がございます。]")
![[商品価格に関しましては、リンクが作成された時点と現時点で情報が変更されている場合がございます。]](https://hbb.afl.rakuten.co.jp/hgb/48b50a19.a272b4b8.48b50a1a.581db4e0/?me_id=1433141&item_id=10000025&pc=https%3A%2F%2Fthumbnail.image.rakuten.co.jp%2F%400_mall%2Fhappynext%2Fcabinet%2F12002380%2Fimgrc0104829129.jpg%3F_ex%3D240x240&s=240x240&t=picttext "[商品価格に関しましては、リンクが作成された時点と現時点で情報が変更されている場合がございます。]")
-
あなたのトークンが下がり続ける理由:壊… 2026.07.18
-
2026年に誰も準備できていない暗号資産の… 2026.07.10
-
先端技術情報20260708 2026.07.08


