PR
X
フリーページ
おすすめCD

DREAM THEATER

EXTREME

DEF LEPPARD

MR.BIG

METALLICA

MEGADETH

LOSTPROPHETS

HOOBASTANK

TRAPT

FOO FIGHTERS

EAGLES

System Of A Down
ローンの計算方法
橘玲
クレジットカードのしくみ
大切な言葉集
この世界を混乱に導く悪魔のルール
ETF140銘柄チャート画像取得マクロ
エクセルVBAで高速フーリエ変換
株・資産運用

1.株式会社の始まり

2.資産形成の方程式

3.利回りに対する理解

4.単利と複利

5.債券価格

6.キャピタルゲインとインカムゲイン

7.株式投資の投資戦略

8.BS(貸借対照表)とPL(損益計算書)の関係

9.リスクと不確実性について

10.72の法則

11.家賃から物件価格を推定する方法

12.レバレッジ

13.ファンダメンタル指標

14.サラリーマンの生涯賃金

15.BPS+EPS×10の有効性

16. 裁定取引 (arbitrage)
fortran90で高速フーリエ変換
カレンダー
2024~25主力株概況3…
New!
みきまるファンドさん
DOW 44860.31 +123.7… New! どらりん0206さん
楽天ラッキーくじ更… じゃっかすさん
自分を愛することは… まりあのじいじさん
パワーアシストロボ… jhiranoさん
DOW 44860.31 +123.7… New! どらりん0206さん
楽天ラッキーくじ更…
 じゃっかすさん
自分を愛することは… まりあのじいじさん
パワーアシストロボ… jhiranoさん
キーワードサーチ
▼キーワード検索
カテゴリ: プログラミング
plotly
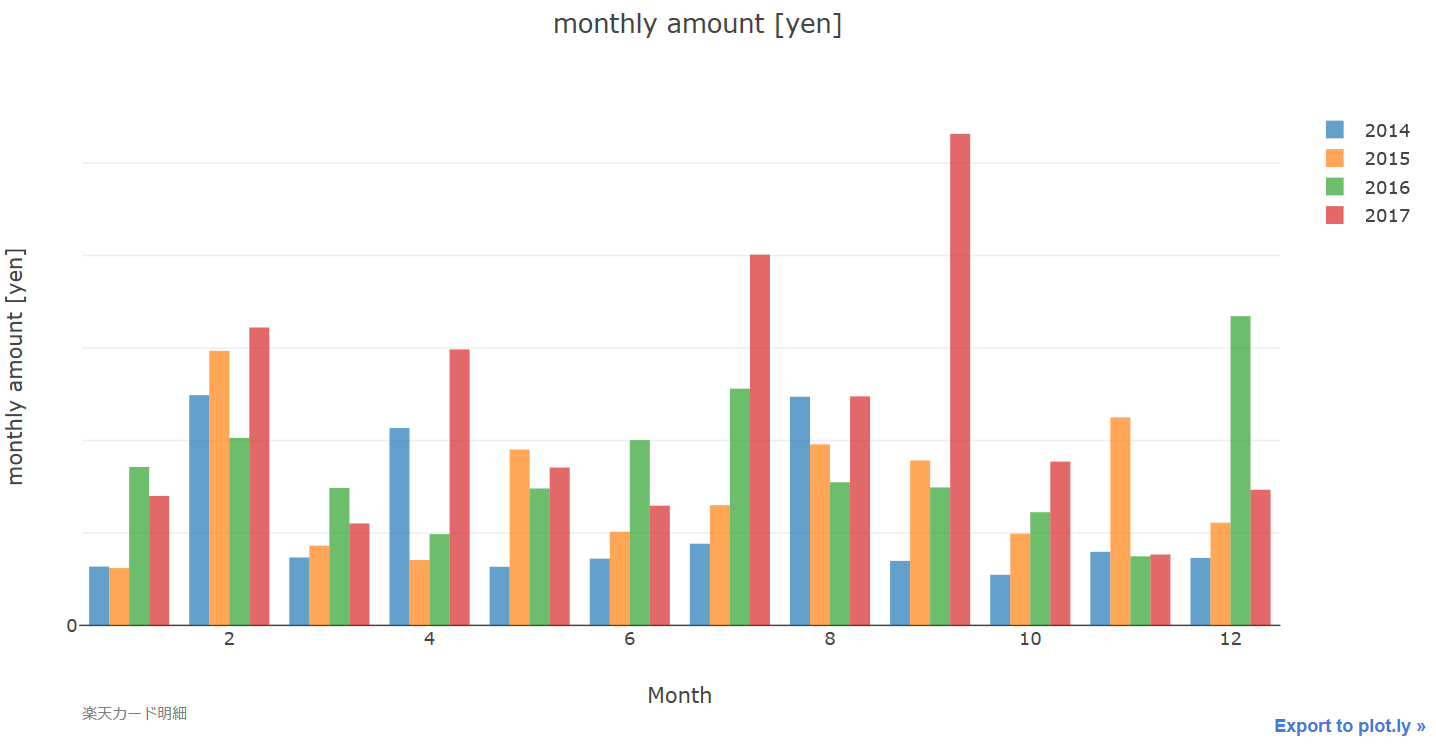
↓月ごとの合計金額を年ごとに比較する棒グラフ

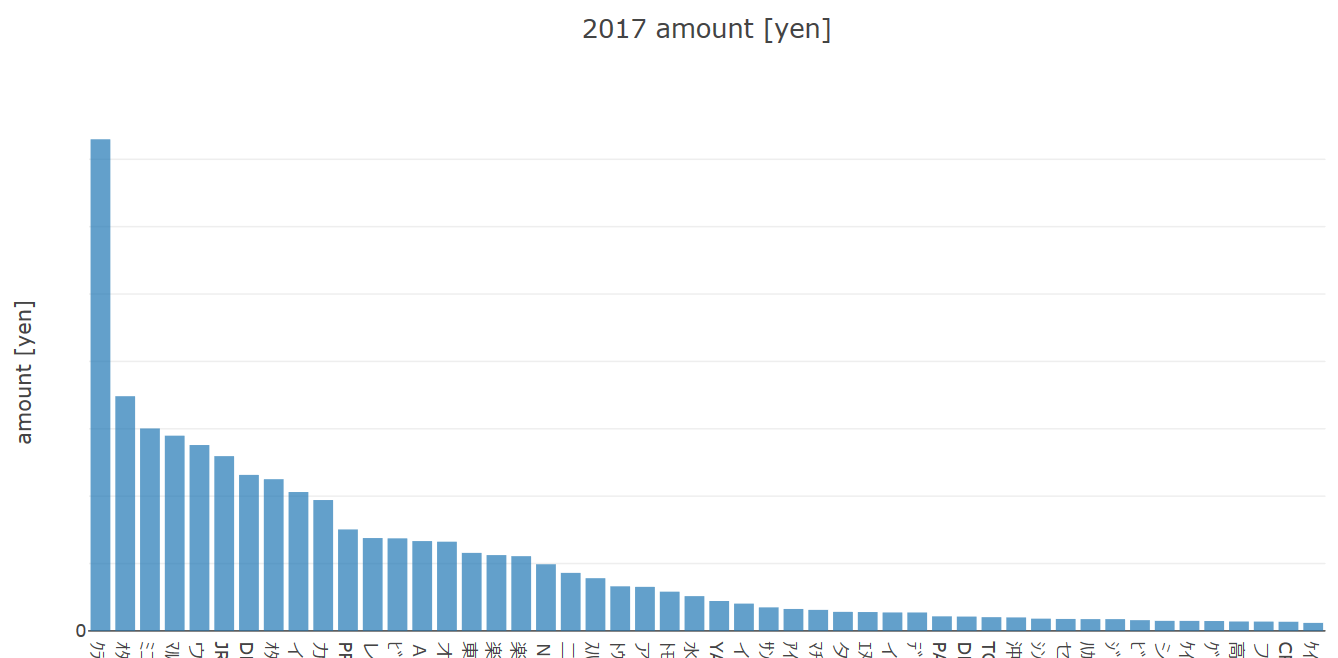
↓2017年で使用額が大きい項目順にソートした棒グラフ

pandasで元のcsvをうまく編集して作成した。
matplotlibとseabornでもできるけれど、plotlyはhover機能があり、マウスポインタをグラフに乗せると数値などを確認できる。さらに凡例をクリックしてグラフの表示、非表示を切り替えられる。
plotlyでの基本的な棒グラフ作成法は以下のリンクにある。
https://plot.ly/python/bar-charts/
udemyでもData Visualisation with Plotly and Pythonというplotlyのコースがある。
-----
I visualized a usage of rakuten card for this four years. But I did not show the amount.
Though I can make bar cahrts with matplotlib and seaborn, plotly has hover feature and mouse cursor on the graph shows the values of the graph and so on. I can switch display and hide by clicking the legend.
The following link shows how to make basic bar charts.
https://plot.ly/python/bar-charts/
udemy also provides the Plotly course, "Data Visualisation with Plotly and Python".

にほんブログ村
↓月ごとの合計金額を年ごとに比較する棒グラフ

↓2017年で使用額が大きい項目順にソートした棒グラフ

pandasで元のcsvをうまく編集して作成した。
matplotlibとseabornでもできるけれど、plotlyはhover機能があり、マウスポインタをグラフに乗せると数値などを確認できる。さらに凡例をクリックしてグラフの表示、非表示を切り替えられる。
plotlyでの基本的な棒グラフ作成法は以下のリンクにある。
https://plot.ly/python/bar-charts/
udemyでもData Visualisation with Plotly and Pythonというplotlyのコースがある。
-----
I visualized a usage of rakuten card for this four years. But I did not show the amount.
Though I can make bar cahrts with matplotlib and seaborn, plotly has hover feature and mouse cursor on the graph shows the values of the graph and so on. I can switch display and hide by clicking the legend.
The following link shows how to make basic bar charts.
https://plot.ly/python/bar-charts/
udemy also provides the Plotly course, "Data Visualisation with Plotly and Python".
にほんブログ村
お気に入りの記事を「いいね!」で応援しよう
最終更新日
2018年01月02日 20時50分34秒 コメントを書く
[プログラミング] カテゴリの最新記事
-
Pyxel Python向けレトロゲームエンジン 2024年01月08日
-
pythonでテトリス 2024年01月07日
-
誕生日のパラドクス 2023年07月29日
【毎日開催】
15記事にいいね!で1ポイント
10秒滞在
いいね!
--
/
--
© Rakuten Group, Inc.


