
AI-generated Key Takeaways
-
This tutorial demonstrates creating an Earth Engine App that uses custom drawing tools to chart an NDVI time series for a user-drawn geometry.
-
The app allows users to draw a rectangle, polygon, or point and displays a mean NDVI chart for the selected area.
-
The app's functionality includes enabling user drawing through button clicks and rendering a time series chart once a geometry is complete.
-
Customizing the drawing tools involves getting the drawing tools widget, hiding the default tools, clearing existing geometries, and initializing a placeholder for drawn geometries.
-
Callback functions are defined to clear previous geometries and initiate drawing for each shape, and a function generates the time series chart based on the drawn geometry and map scale.
-
The user interface consists of a control panel with instructions and buttons for selecting drawing modes, adding the panel and chart panel to the map.
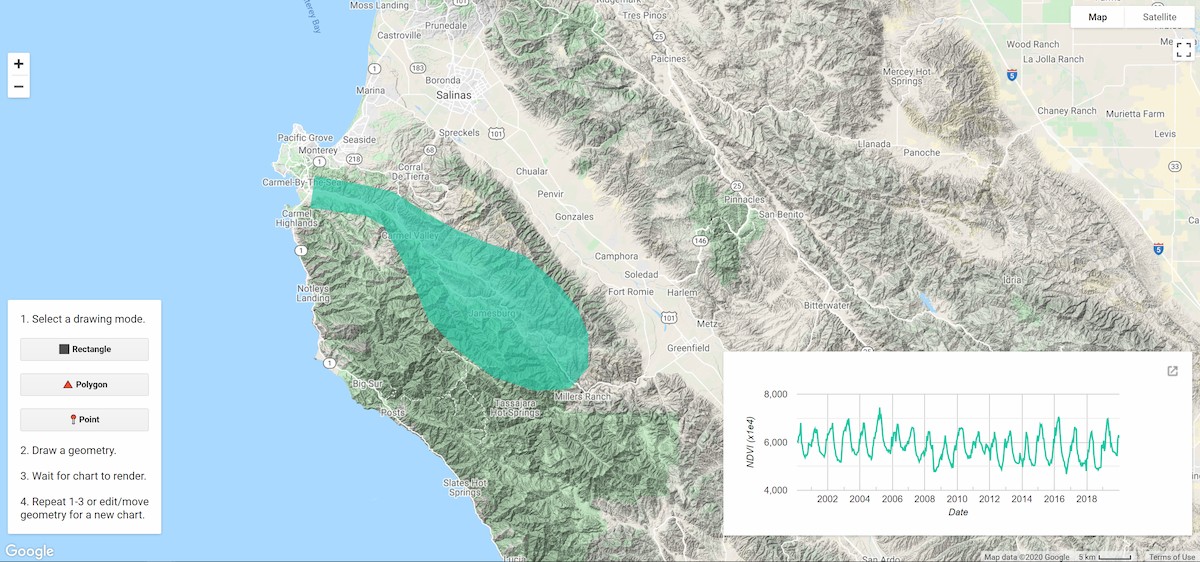 The Earth Engine App resulting from this
tutorial. Shown is an NDVI time series chart for the drawn polygon around
Carmel Valley, California.
The Earth Engine App resulting from this
tutorial. Shown is an NDVI time series chart for the drawn polygon around
Carmel Valley, California.
Functionality
The app has two main functions: 1) allow a user to draw a geometry and; 2) render a region reduction time series chart for the drawn geometry. Clicking a "draw" button will allow a user to draw a geometry, and once the drawing is complete, the chart will render. These two events (button click to draw and drawing finished) need associated functions to complete the event-callback cycle.
Custom drawing tools
Before defining callback functions, setup drawingTools
for custom use.
1. Get the drawing tools widget object; define it as a variable for convenience in recalling it later.
  var

 drawingTools

 =

 Map
 .
 drawingTools
 ();
2. Hide the default drawing tools so you can add your own. You can use the default drawing tools for interactive region reduction, but they provide more functionality than is needed when simplicity is the goal.
  drawingTools
 .
 setShown
 (
 false
 );
3. Setup a while loop to clear all existing geometries that have been added as imports from drawing tools (from previously running the script). The design of the app is to handle charting a time series for a single geometry, so remove any that exist.
  while

 (
 drawingTools
 .
 layers
 ().
 length
 ()
 >
 0
 )

 {

 var

 layer

 =

 drawingTools
 .
 layers
 ().
 get
 (
 0
 );

 drawingTools
 .
 layers
 ().
 remove
 (
 layer
 );
 }
4. Initialize a dummy GeometryLayer
with null
geometry to act as a
placeholder for drawn geometries.
  var

 dummyGeometry

 =

 ui
 .
 Map
 .
 GeometryLayer
 ({
 geometries
 :

 null
 ,

 name
 :

 'geometry'
 ,

 color
 :

 '23cba7'
 });
 drawingTools
 .
 layers
 ().
 add
 (
 dummyGeometry
 );
Event callback functions
Define callback functions to enable drawing and chart rendering, they will be attached to event listeners in the following sections.
Drawing buttons
Define a series of functions that are called when geometry
drawing buttons are clicked: one for clearing the previous geometry from
the GeometryLayer
and one for each drawing mode button
(rectangle, polygon, and point).
1. Define the geometry clearing function.
  function

 clearGeometry
 ()

 {

 var

 layers

 =

 drawingTools
 .
 layers
 ();

 layers
 .
 get
 (
 0
 ).
 geometries
 ().
 remove
 (
 layers
 .
 get
 (
 0
 ).
 geometries
 ().
 get
 (
 0
 ));
 }
2. Define functions that will be called when each respective drawing
button is clicked. Each function will clear previous drawings using the clearGeometry
function and then initialize drawing for the particular drawing
mode.
  function

 drawRectangle
 ()

 {

 clearGeometry
 ();

 drawingTools
 .
 setShape
 (
 'rectangle'
 );

 drawingTools
 .
 draw
 ();
 }
 function

 drawPolygon
 ()

 {

 clearGeometry
 ();

 drawingTools
 .
 setShape
 (
 'polygon'
 );

 drawingTools
 .
 draw
 ();
 }
 function

 drawPoint
 ()

 {

 clearGeometry
 ();

 drawingTools
 .
 setShape
 (
 'point'
 );

 drawingTools
 .
 draw
 ();
 }
Regional time series chart
1. Define a panel to hold the time series chart. Set the shown
style
parameter to false
to initially hide the panel until the first chart is
rendered.
  var

 chartPanel

 =

 ui
 .
 Panel
 ({

 style
 :

 {
 height
 :

 '235px'
 ,

 width
 :

 '600px'
 ,

 position
 :

 'bottom-right'
 ,

 shown
 :

 false
 }
 });
2. Add the panel to the Map
.
  Map
 .
 add
 (
 chartPanel
 );
3. Define a function that gets called on geometry drawing completion and
editing events to generate an NDVI time series
chart for the drawn region. See code comments for an explanation of each step.
In summary, the function shows the chart panel on the first drawing event,
clears previously rendered charts, gets the drawn geometry, calculates the
region reduction scale based on the Map
scale, and renders a chart in the
chart panel.
  function

 chartNdviTimeSeries
 ()

 {

 // Make the chart panel visible the first time a geometry is drawn.

 if

 (
 !
 chartPanel
 .
 style
 ().
 get
 (
 'shown'
 ))

 {

 chartPanel
 .
 style
 ().
 set
 (
 'shown'
 ,

 true
 );

 }

 // Get the drawn geometry; it will define the reduction region.

 var

 aoi

 =

 drawingTools
 .
 layers
 ().
 get
 (
 0
 ).
 getEeObject
 ();

 // Set the drawing mode back to null; turns drawing off.

 drawingTools
 .
 setShape
 (
 null
 );

 // Reduction scale is based on map scale to avoid memory/timeout errors.

 var

 mapScale

 =

 Map
 .
 getScale
 ();

 var

 scale

 =

 mapScale
 >
 5000

 ?

 mapScale

 *

 2

 :

 5000
 ;

 // Chart NDVI time series for the selected area of interest.

 var

 chart

 =

 ui
 .
 Chart
 .
 image

 .
 seriesByRegion
 ({

 imageCollection
 :

 ee
 .
 ImageCollection
 (
 'MODIS/006/MOD13A2'
 ),

 regions
 :

 aoi
 ,

 reducer
 :

 ee
 .
 Reducer
 .
 mean
 (),

 band
 :

 'NDVI'
 ,

 scale
 :

 scale
 ,

 xProperty
 :

 'system:time_start'

 })

 .
 setOptions
 ({

 titlePostion
 :

 'none'
 ,

 legend
 :

 {
 position
 :

 'none'
 },

 hAxis
 :

 {
 title
 :

 'Date'
 },

 vAxis
 :

 {
 title
 :

 'NDVI (x1e4)'
 },

 series
 :

 {
 0
 :

 {
 color
 :

 '23cba7'
 }}

 });

 // Replace the existing chart in the chart panel with the new chart.

 chartPanel
 .
 widgets
 ().
 reset
 ([
 chart
 ]);
 }
4. Set the drawing tools widget to listen for geometry drawing and editing
events and respond with the chartNdviTimeSeries
function.
Note that ui.util.debounce
wraps the chartNdviTimeSeries
function to
reduce the frequency of it being invoked while drawing and editing a
geometry. Here, the delay is set to 500 milliseconds or 0.5 seconds.
  drawingTools
 .
 onDraw
 (
 ui
 .
 util
 .
 debounce
 (
 chartNdviTimeSeries
 ,

 500
 ));
 drawingTools
 .
 onEdit
 (
 ui
 .
 util
 .
 debounce
 (
 chartNdviTimeSeries
 ,

 500
 ));
User interface
This section defines the drawing control panel, which contains instructions and drawing tool buttons.
1. Define a dictionary of symbols to augment the text label for each of the geometry buttons defined in the following step. The symbols are kept separate from the text to avoid unexpected cursor behavior when mixing symbols and text.
  var

 symbol

 =

 {

 rectangle
 :

 '⬛'
 ,

 polygon
 :

 '🔺'
 ,

 point
 :

 '📍'
 ,
 };
2. Define a ui.Panel
to hold app instructions and the geometry drawing
buttons. Use a ui.Label
for each instruction line and a ui.Button
for
each of the three geometry drawing options. Button labels are the
concatenation of the symbols defined in the previous step and text. Set the onClick
parameter to each respective drawing mode callback function defined
above.
  var

 controlPanel

 =

 ui
 .
 Panel
 ({

 widgets
 :

 [

 ui
 .
 Label
 (
 '1. Select a drawing mode.'
 ),

 ui
 .
 Button
 ({

 label
 :

 symbol
 .
 rectangle

 +

 ' Rectangle'
 ,

 onClick
 :

 drawRectangle
 ,

 style
 :

 {
 stretch
 :

 'horizontal'
 }

 }),

 ui
 .
 Button
 ({

 label
 :

 symbol
 .
 polygon

 +

 ' Polygon'
 ,

 onClick
 :

 drawPolygon
 ,

 style
 :

 {
 stretch
 :

 'horizontal'
 }

 }),

 ui
 .
 Button
 ({

 label
 :

 symbol
 .
 point

 +

 ' Point'
 ,

 onClick
 :

 drawPoint
 ,

 style
 :

 {
 stretch
 :

 'horizontal'
 }

 }),

 ui
 .
 Label
 (
 '2. Draw a geometry.'
 ),

 ui
 .
 Label
 (
 '3. Wait for chart to render.'
 ),

 ui
 .
 Label
 (

 '4. Repeat 1-3 or edit/move\ngeometry for a new chart.'
 ,

 {
 whiteSpace
 :

 'pre'
 })

 ],

 style
 :

 {
 position
 :

 'bottom-left'
 },

 layout
 :

 null
 ,
 });
3. Add the panel to the Map
.
  Map
 .
 add
 (
 controlPanel
 );
Result
The following animation is the result of putting the entire script together and publishing it as an Earth Engine App. The simplicity of this custom drawing tool interface and automatic clearing of the previous drawing and plot will allow you and your app users to focus on exploring data instead of geometry management.

Learn more about the drawing tools API in the Getting Started with Drawing Tools tutorial.