

PR

令和維新
2004年4月から企業を離れ、コンサルタントや情報起業を試行しなが ら、失われた20年を取り戻し、日本再生をめざす私の歩みをみて一人でも多くの後継者が出てくれることを祈りつつ友達から紹 介されたこのホームページの更新を続け、これまでの活動の記録と今やビッグデータ、AI,、IOT,ブロックチェーン、仮想通貨の時代になってしまいましたが、私の現状認識と関連技術を紹介していきたい。
デフレーションの強制継続
イーサリアムの長期戦:なぜ2026年がすべてを変える年になり得るのか(Ethereum's Long Game: Why 2026 Could Be the Year That Changes Everything)
テクニカル・ドキュメンテーションのためのコンテンツ・デザイン実践の構築(Building a Content Design Practice for Technical Documentation
(1)トークン化は注目の話題である。しかし、それを現実世界で機能させることが最も難しい部分だ(Tokenization Is a Hot Topic. Making It Work in the Real World Is the Hard Part.)
先端技術情報20260726
「マジ面倒くさいなあ」日本を衰退させた愚者たち
市場フェーズの解説:蓄積、拡大、分配、リセット(Market Phases Explained: Accumulation, Expansion, Distribution, Reset)
(2)テクニカルドキュメンテーションのためのコンテンツデザイン実践の構築(Building a Content Design Practice for Technical Documentation)
先端技術情報20260725
Comments
 New!
藻緯羅さん
New!
藻緯羅さん🌸 新作「二人の宇宙… New! 神風スズキさん
E851形 キハ81系特…
New!
GKenさん源氏物語〔35帖 柏木…
New!
USM1さんハープコンサート in… 47弦の詩人さん
Category
カテゴリ未分類
(112)連絡
(24)交流会
(27)セミナー
(29)参考情報
(138)オフ会
(36)on-line報告会
(13)翻訳ビジネス
(8)情報開発
(270)ビッグデータ
(88)ブロックチェーン
(248)人工知能
(534)IOT
(307)仮想通貨
(866)コンテンツ
(127)政治経済
(1944)先端技術
(962)DITA
(52)テレワーク
(28)UX
(0)文書管理
(8)テクニカルライテイング
(23)学習
(9)訓練
(1)XMLソリューション
(3)メタバース
(101)Web3
(68)投資
(191)IoT
(34)投資信託
(1)ビットコイン
(786)イーサリアム
(163)NFT
(41)オンライン
(0)受動収入
(14)ソーシャルメデイア
(0)DAO
(2)DeFi
(79)暗号通貨
(168)トークノミクス
(22)アルトコイン
(229)空中投下
(16)スマート契約
(4)ステーブルコイン
(42)金
(5)生成AI
(5)SCM
(4)ウオレット
(9)不労所得
(58)セキュリテイ
(4)ミームコイン
(50)CBDC
(5)PoS
(3)PoW
(1)ETF
(15)仮想通貨ETF
(1)予言
(7)裁定取引
(1)GameFi
(5)マイニング
(9)RWA
(23)DePIN
(22)SWFT
(1)WLFI
(1)アービトラージ
(7)XRP
(67)大統領選
(4)BCH
(1)取引ボット
(17)トレーデイング
(52)不動産
(1)詐欺
(4)貿易戦争
(1)医療
(1)金融
(2)TEZOS
(1)CARDANO
(2)カルダーノ
(3)ステーキング
(5)チェーンリンク
(1)開発
(0)HEDERA
(3)スマートマネー
(0)流動性
(0)AIエージェント
(19)401k
(1)国際送金
(1)solano
(1)AI
(1)暗号資産
(74)機関投資家
(5)量子コンピューター
(4)AIエージェント
(1)ドキュメンテーション
(2)AIトレーデイング
(1)Keyword Search
Freepage List


Shopping List
Why?
何故か。
Because the Wall Street ETFs account for 15
to 20% of Bitcoin activity on any given day. When the ETFs move those tokens,
they do not buy and sell the same tokens they acquired for their clients. They
can move any Bitcoin from any time.
ウォール街の
ETF
は、特定の日のビットコイン活動の
15
〜
20%
を占めているためです。
ETF
がこれらのトークンを移動するとき、
ETF
はクライアントのために取得したのと同じトークンを売買しません。彼らはいつでも任意のビットコインを移動できます。
As a result, these metrics no longer
capture genuine individual user behavior and intent. While they probably point
in the right direction, their absolute values are probably not valid anymore.
For each day, each variable could drift 15–20%.
その結果、これらの指標は、個々のユーザーの行動や意図を捉えることができなくなっています。それらはおそらく正しい方向を指していますが、その絶対値はおそらくもはや有効ではありません。各日、各変数は
15
から
20%
変動する可能性があります。
Look beyond the on-chain data. Incorporate
common psychological and investment frameworks. Do a little technical analysis.
Try to identify changes in market participants’ behavior.
オンチェーンデータの先を見据える。共通の心理学的および投資的フレームワークを組み込みます。少しテクニカル分析をしてください。市場参加者の行動の変化を見極めるようにしてください。
Often, there’s more than meets the eye.
多くの場合、目に見える以上のものがあります。
Best we got
最高のもの
I’m seeing lots of talk about validating
and invalidating cycle theories and data models.
サイクル理論やデータモデルの検証と無効化についての話をたくさん見かけます。
I remember how it felt from 2019 to 2022,
when analysts spent a lot of time debating which model and prediction would be
right. With the benefit of time and reflection, we know the answer.
2019
年から
2022
年にかけて、アナリストがどのモデルや予測が正しいかを議論するのに多くの時間を費やした時の気持ちを覚えています。時間と熟考の恩恵を受けることで、私たちは答えを知っています。
I wrapped this into a report, Exposing
Bitcoin Data Models and Cycle Theories: Good, Bad, and Ugly
.
私はこれをレポートにまとめました、
:
良い、悪い、そして醜い。
Exposing Bitcoin Data Models and Cycle Theories: Good, Bad,
Ugly
ビットコインのデータモデルとサイクル理論の公開
: 良い、悪い、醜い
Are you buying into this?
これを信じますか
?
In my report, you’ll learn what these models say and what you can use them for. It’s free until the end of this month. On June 1, 2025, it will revert to premium-only content.
私のレポートでは、これらのモデルが何を言っているのか、そしてそれらを何に使用できるのかを学びます。今月末まで無料です。
2025
年
6
月
1
日より、プレミアム限定コンテンツに戻ります。
For example, stock to flow (S2F) predicts huge prices this year. Do you want to know something crazy?
たとえば、ストック2フロー
(S2F)
は、今年の巨大な価格を予測します。何かクレイジーなことを知りたいですか
?
S2F’s range is so wide that you can’t plan anything around it. Bitcoin’s price can go 50% lower and 400% higher for months at a time.
S2F
の範囲は非常に広いため、それを中心に何も計画することはできません。ビットコインの価格は、一度に数か月にわたって
50%
低く、
400%
高くなる可能性があります。
Which makes for a wild coincidence.
これは、驚くほどの偶然です。
January’s all-time high of $109,300 hit exactly where S2F predicted it would.
1
月の史上最高値である
109,300
ドルは、
S2F
が予測した通りの数字でした。
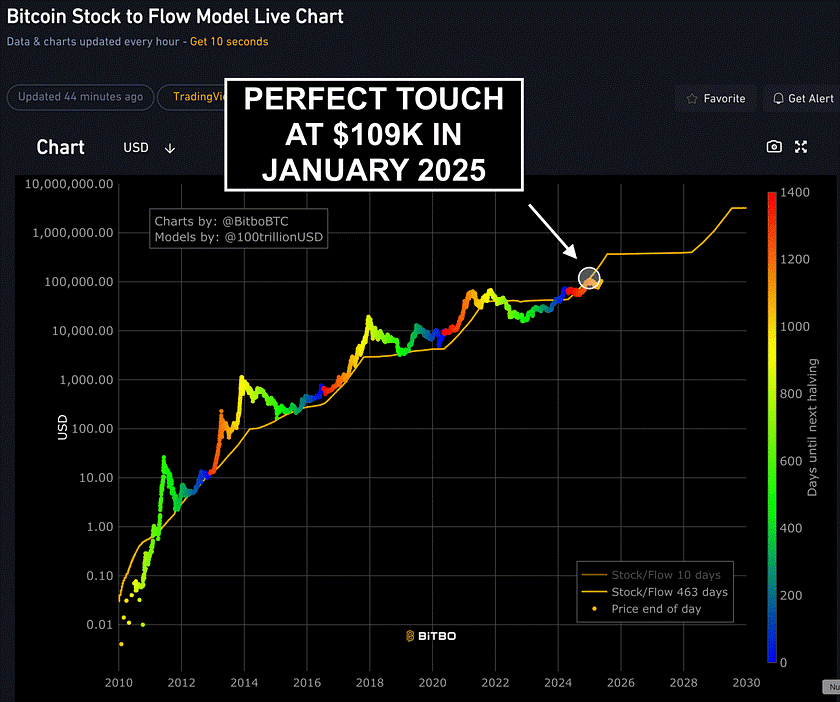
S2F’s creator ignores this. Wouldn’t it be ironic if the one time S2F was accurate, nobody believed it?
S2F
の作成者はこれを無視します。かつての
S2F
が正確だったのに、誰もそれを信じなかったとしたら、皮肉なことではないでしょうか
?
(If that seems contradictory or wrong, ask yourself why you believe in S2F when it tells you what you want to see, but not when it tells you things you don’t want to see.)
(
それが矛盾している、または間違っていると思われる場合は、
S2F
が見たいものを教えてくれるのに、見たくないものを教えてくれるのに信じないのはなぜか、自分に問いかけてみてください。)
A big drop this summer — let’s say to $50,000 — would throw everybody for a loop. That outcome would likely come from a larger problem in the legacy financial system.
今年の夏に
5
万ドルまで大きく下がれば、誰もがループに陥るでしょう。その結果は、従来の金融システムのより大きな問題から生じる可能性があります。
As such, you’ll see the global money printer start up and pump the markets. Could you imagine a quick 3x to $150,000 from September to December? A re-run of the October 2020 — January 2021 zoom?
このように、グローバルな造幣が立ち上がり、市場を盛り上げるのを目にするでしょう。
9
月から
12
月にかけて、
3
倍の
150,000
ドルを想像できますか。
2020
年
10
月〜
2021
年
1
月のズームの再現か。
This could also fit the classic Elliott Wave A-B-C correction pattern below before kicking off another five-wave uptrend as follows, with Wave 2’s low coinciding with the end of 2026 — exactly where Bob Loukas’s version of the four-year cycle predicts the next long-term
structural bottom.
これは、以下の古典的なエリオット波動
A-B-C
調整パターンにも適合し、その後、第
2
波の安値が
2026
年末と一致するという別の
5
波の上昇トレンドを開始する可能性があります。
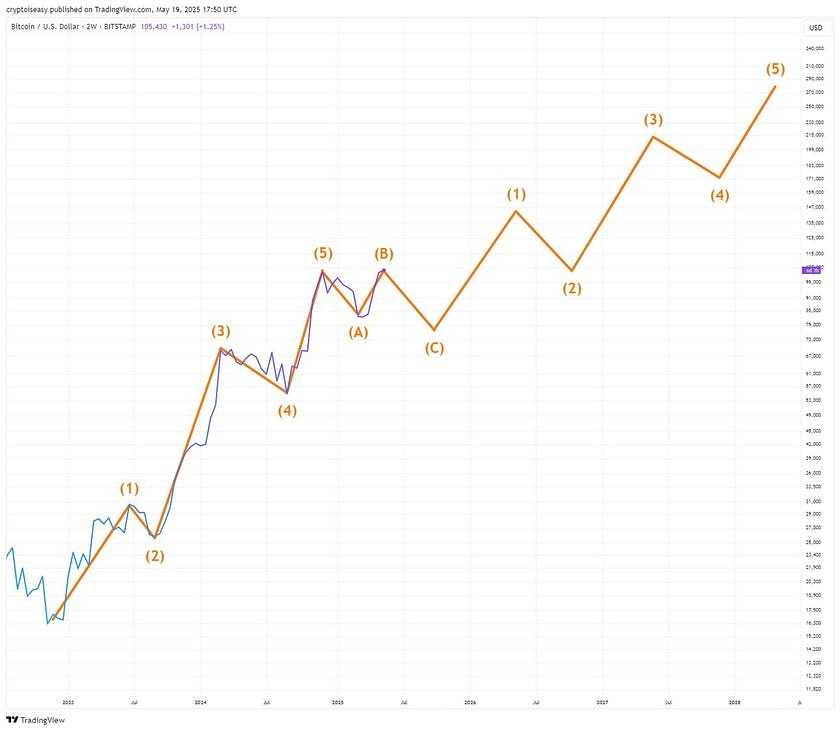
That’s the amazing power of these data models and cycle theories. They all disagree with each other — and fit.
それが、これらのデータモデルとサイクル理論の驚くべき力です。彼らは皆、互いに意見が合わないが、そして合っています。
About that bear market . . .
弱気相場について…
You’ll hear people tell you, “The bears are in disbelief.”
「弱気は信じられない」と言われるのを聞くでしょう。
What if the bulls are the ones in disbelief?
もし強気派が不信感を抱いていたらどうなるか。
Flip the classic Wall Street cheat sheet upside down, and the past few months look like the start of “disbelief” for the bulls.
ウォール街の古典的なカンニングペーパーを上下ひっくり返すと、過去数ヶ月は強気派にとって「不信」の始まりのように見えます。
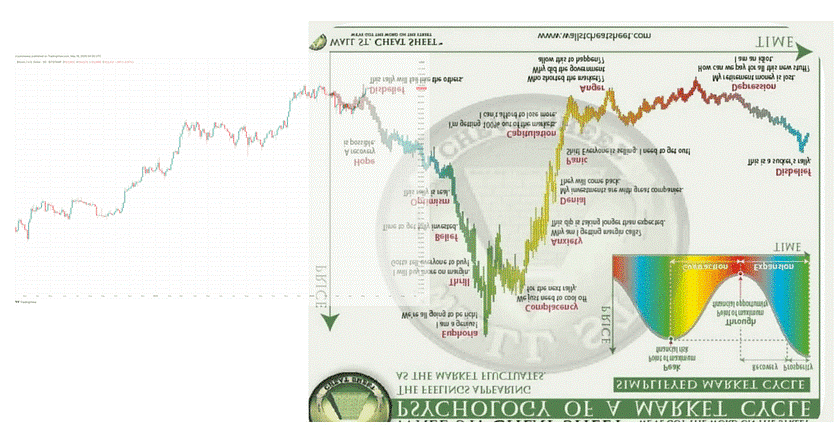
I’ll call this a bull market until everybody agrees it’s not. For an asset that goes up 300% in bear markets and drops 70% in bull markets, you can’t get so precise.
私はこれを強気市場と呼ぶことにしますが、誰もがそうではないと同意します。弱気市場で
300%
上昇し、強気市場で
70%
下落する資産の場合、それほど正確には理解できません。
Why You Shouldn’t Care About Bitcoin’s Bull or Bear Market
ビットコインの強気市場や弱気市場を気にすべきではない理由
As long as you appreciate the circumstances, you don’t need to think about bull/bear. If anything, you should hope we are in a bear market because they give you the best buying
opportunities.
状況を理解している限り、強気
/
弱気について考える必要はありません。どちらかといえば、私たちが弱気市場にあることを願うべきです、なぜなら彼らはあなたに最高の購入機会を与えるからです。
For all assets, bear markets often start with a strong rally. The most famous is probably the four-month, 40% rally at the start of the Great Depression.
すべての資産にとって、弱気相場はしばしば強い上昇から始まります。最も有名なのは、おそらく大恐慌が始まったときの
4
ヶ月間、
40%
の上昇でしょう。
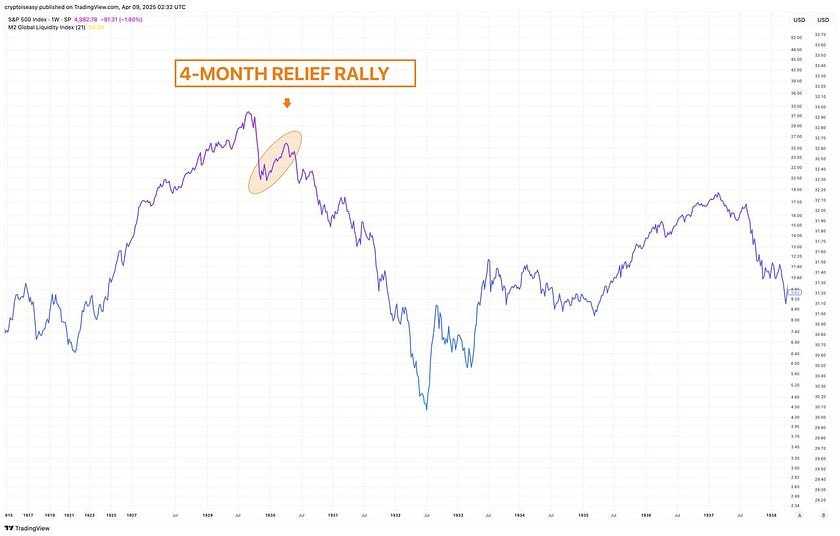
Most rallies aren’t so pronounced. 1981’s drop in the S&P 500 started with a rally of 13% and gave you two more double-digit rallies as the index fell for almost two years.
ほとんどの上昇はそれほど目立ちません。
1981
年の
S&P500
の下落は
13%
の上昇で始まり、指数がほぼ
2
年間下落したため、さらに
2
桁の上昇をもたらしました。
When these rallies start, you can’t tell whether they complete a normal correction before the market goes higher, or reflect a momentary relief before a larger downturn. You have to take a leap of faith — and no guru, data model, or cycle theory can tell you how that leap
will turn out.
これらの上昇が始まったとき、市場が上昇する前に通常の調整を完了するのか、それとも大きな下落の前に一時的な安堵を反映しているのかはわかりません。あなたは信念を飛躍させなければなりません
-
そして、、第一人者、データモデル、またはサイクル理論もその飛躍がどのようになるかをあなたに伝えることはできない。
The greatest investors and traders can’t get their timing right. Warren Buffett says he doesn’t try. Why should you?
最高の投資家やトレーダーは、タイミングを合わせることができません。ウォーレン・バフェットは、試みないと言っています。なぜそうすべきなのでしょうか
?
Imagine that
想像してみて
Imagine if we do something like 2014 and range from $90k-ish to 100k-ish for the next two months. You keep putting money in expecting a huge Q3 and whatever else the gurus say. Everybody agrees with you.
2014
年のようなものを行い、今後
2
ヶ月間で
9
万ドルから
10
万ドル程度の範囲になると想像してみてください。あなたは巨大な
Q3
を期待してお金を投入し続けます、そして、他の専門家が言うこと他の何でも。誰もがあなたに同意します。
Then the wheels fall off.
すると車輪が外れます。
Near the end of that four-month, 40% rally mentioned above, Herbert Hoover gave a speech about how deflating the stock market shifted capital from dirty, greedy speculators to good, honest US businesses.
上述の
4
ヶ月間の
40%
上昇の終わり近くで、ハーバート・フーバーは、株式市場の収縮が、資本を汚くて貪欲な投機家から善良で正直な米国企業へとどのようにシフトさせたかについてのスピーチを行った。
Within a year, the economy was in ruins.
1
年も経たないうちに、経済は崩壊した。
When JP Morgan bought Bear Sterns, Wall Street said everything was fixed. The Fed chairman told the world he could not see a US recession.
JP
モルガンがベア・スターンズを買収したとき、ウォール街は全てが修正されたと言った。
FRB
議長は、米国の景気後退は見られないと世界に語った。
The Great Recession started that year.
その年に大不況が始まりました。
When I was in college, politicians told me the 9/11 attacks caused the bear market in US stocks from 2001 to 2003. That’s impossible. The market peaked in March 2000.
私が大学にいたとき、政治家たちは、
9.11
攻撃が
2001
年から
2003
年にかけての米国株の弱気相場を引き起こしたと教えてくれました。不可能です。市場は
2000
年
3
月にピークを迎えました。
Everybody loves a good story. Often, bigger factors are at play.
誰もが良い話が大好きですが、多くの場合、より大きな要因が進行中です。
Big shifts happen over months. Your Internet algorithm adjusts minute by minute, day by day.
大きな変化は数か月にわたって起こります。インターネットのアルゴリズムは、分刻みで、日々調整されます。
You hear somebody tell you that the last time SPX fell more than 10% in a month, then rallied to close less than 2% down, was the Great Depression.
SPX
(
S&P500
)が
1
か月で
10%
以上下落し、その後反発して
2%
未満の下落で終了したのは大恐慌だったと誰かが言うのを聞きます。
Then you hear somebody say that the last time SPY erased a 2% intraday decline, it marked the bottom of the 2022 bear market.
そして、前回
SPY
(
S
&
P500ETF
)が日中の
2%
の下落を帳消しにしたときは、
2022
年の弱気相場の底をマークしたと誰かが言うのを耳にします。
=============================
インターネット・コンピュータランキング
ネットサービスランキング
==============================
![[商品価格に関しましては、リンクが作成された時点と現時点で情報が変更されている場合がございます。]](https://hbb.afl.rakuten.co.jp/hgb/437b760c.d63ec5b2.437b760d.f56d76c1/?me_id=1348609&item_id=10001258&pc=https%3A%2F%2Fthumbnail.image.rakuten.co.jp%2F%400_mall%2Ff252131-higashiomi%2Fcabinet%2F11450933%2Fimgrc0091653667.jpg%3F_ex%3D240x240&s=240x240&t=picttext "[商品価格に関しましては、リンクが作成された時点と現時点で情報が変更されている場合がございます。]")

![[商品価格に関しましては、リンクが作成された時点と現時点で情報が変更されている場合がございます。]](https://hbb.afl.rakuten.co.jp/hgb/1f7a7d92.b83d1f60.1f7a7d93.c095e264/?me_id=1316542&item_id=10004579&pc=https%3A%2F%2Fthumbnail.image.rakuten.co.jp%2F%400_mall%2Ff452025-miyakonojo%2Fcabinet%2F08218569%2Ff3-yakinikuejima%2Fmj-f302_0709_fjx-.jpg%3F_ex%3D240x240&s=240x240&t=picttext "[商品価格に関しましては、リンクが作成された時点と現時点で情報が変更されている場合がございます。]")
![[商品価格に関しましては、リンクが作成された時点と現時点で情報が変更されている場合がございます。]](https://hbb.afl.rakuten.co.jp/hgb/3bd6b821.79536051.3bd6b822.17595506/?me_id=1319096&item_id=10000885&pc=https%3A%2F%2Fthumbnail.image.rakuten.co.jp%2F%400_mall%2Fsoo-ya%2Fcabinet%2Fchuukopc%2F06999677%2F09458120%2Frakutenn-000q5.jpg%3F_ex%3D240x240&s=240x240&t=picttext "[商品価格に関しましては、リンクが作成された時点と現時点で情報が変更されている場合がございます。]")
![[商品価格に関しましては、リンクが作成された時点と現時点で情報が変更されている場合がございます。]](https://hbb.afl.rakuten.co.jp/hgb/08733d95.84a0fd0f.08733d96.10216c18/?me_id=1213310&item_id=20993568&pc=https%3A%2F%2Fthumbnail.image.rakuten.co.jp%2F%400_mall%2Fbook%2Fcabinet%2F5563%2F4549576215563.jpg%3F_ex%3D240x240&s=240x240&t=picttext "[商品価格に関しましては、リンクが作成された時点と現時点で情報が変更されている場合がございます。]")
Xbox Series S 1TB (ブラック) 価格:44,577円(税込、送料無料) (2024/5/5時点)
![[商品価格に関しましては、リンクが作成された時点と現時点で情報が変更されている場合がございます。]](https://hbb.afl.rakuten.co.jp/hgb/3bd25767.ee8833bd.3bd25768.a1caa8f0/?me_id=1338494&item_id=10000034&pc=https%3A%2F%2Fthumbnail.image.rakuten.co.jp%2F%400_mall%2Fsmoothskin%2Fcabinet%2Fproduct-image%2Fbare%2F01bareplus1.jpg%3F_ex%3D240x240&s=240x240&t=picttext "[商品価格に関しましては、リンクが作成された時点と現時点で情報が変更されている場合がございます。]")
![[商品価格に関しましては、リンクが作成された時点と現時点で情報が変更されている場合がございます。]](https://hbb.afl.rakuten.co.jp/hgb/3afcaeb9.0e6d0618.3afcaeba.5c084c8e/?me_id=1371293&item_id=10000071&pc=https%3A%2F%2Fthumbnail.image.rakuten.co.jp%2F%400_mall%2Fsunshine-osaka%2Fcabinet%2F09337950%2Febi100samuneru02.jpg%3F_ex%3D240x240&s=240x240&t=picttext "[商品価格に関しましては、リンクが作成された時点と現時点で情報が変更されている場合がございます。]")
60%以上えび(具)海老 エビ えび 一龍堂 餃子 ぎょうざ ギョウザ ギョーザ 100個 えび餃子 海老餃子 冷凍 生餃子 冷凍食品 冷凍餃子 送料無料 鮮度抜群 ぷりぷり 惣菜 中華惣菜 中華点心 人気 極上 贅沢 価格:7,960円(税込、送料無料) (2024/5/1時点)
![[商品価格に関しましては、リンクが作成された時点と現時点で情報が変更されている場合がございます。]](https://hbb.afl.rakuten.co.jp/hgb/3bd25c5a.f5ae1e6f.3bd25c5b.9072cadb/?me_id=1338178&item_id=10000015&pc=https%3A%2F%2Fthumbnail.image.rakuten.co.jp%2F%400_mall%2Fmashiro%2Fcabinet%2F82xsakura%2Fthumb%2Fimgrc0106198089.jpg%3F_ex%3D240x240&s=240x240&t=picttext "[商品価格に関しましては、リンクが作成された時点と現時点で情報が変更されている場合がございます。]")
![[商品価格に関しましては、リンクが作成された時点と現時点で情報が変更されている場合がございます。]](https://hbb.afl.rakuten.co.jp/hgb/3c5b7654.02273dfa.3c5b7655.0ebf4fa0/?me_id=1396705&item_id=10001358&pc=https%3A%2F%2Fthumbnail.image.rakuten.co.jp%2F%400_mall%2Fkrdirect%2Fcabinet%2Fnewpc%2Fn95j_01_.jpg%3F_ex%3D240x240&s=240x240&t=picttext "[商品価格に関しましては、リンクが作成された時点と現時点で情報が変更されている場合がございます。]")
![[商品価格に関しましては、リンクが作成された時点と現時点で情報が変更されている場合がございます。]](https://hbb.afl.rakuten.co.jp/hgb/08733d95.84a0fd0f.08733d96.10216c18/?me_id=1213310&item_id=21407346&pc=https%3A%2F%2Fthumbnail.image.rakuten.co.jp%2F%400_mall%2Fbook%2Fcabinet%2F6320%2F4948872416320.jpg%3F_ex%3D240x240&s=240x240&t=picttext "[商品価格に関しましては、リンクが作成された時点と現時点で情報が変更されている場合がございます。]")
PlayStation5 Pro 価格:119,980円(税込、送料無料) (2024/10/2時点)
![[商品価格に関しましては、リンクが作成された時点と現時点で情報が変更されている場合がございます。]](https://hbb.afl.rakuten.co.jp/hgb/41d0c158.9ad88c57.41d0c159.cc9e9b33/?me_id=1408256&item_id=10000043&pc=https%3A%2F%2Fthumbnail.image.rakuten.co.jp%2F%400_mall%2Fepeios-official%2Fcabinet%2Fsalemain%2Fnaps-008.jpg%3F_ex%3D240x240&s=240x240&t=picttext "[商品価格に関しましては、リンクが作成された時点と現時点で情報が変更されている場合がございます。]")
-
FRBがちょうど造幣へと転じた—それがビッ… 2026.07.13
-
トランプの経済ビジョン:2026年がアメリ… 2026.07.03
-
次の世界的な準備金通貨は純粋にデジタル… 2026.06.30


