


PR
令和維新
2004年4月から企業を離れ、コンサルタントや情報起業を試行しなが ら、失われた20年を取り戻し、日本再生をめざす私の歩みをみて一人でも多くの後継者が出てくれることを祈りつつ友達から紹 介されたこのホームページの更新を続け、これまでの活動の記録と今やビッグデータ、AI,、IOT,ブロックチェーン、仮想通貨の時代になってしまいましたが、私の現状認識と関連技術を紹介していきたい。
「中国のデフレーションは、人類史の金字塔」非・民主制国家のデフレーション(後編)
デジタルドルのステーブルコイン版はあなたの投資を助けるか、それとも損なうか(Will a Stable Coin Version of the Digital Dollar Help or Hurt Your Investments?)
ウォーレン・バフェットが株式を評価するように、暗号資産の機会を評価する方法( How to evaluate crypto opportunities like Warren Buffett assesses a stock)
(2)AIエンジニアとして15-20万ドルを稼ぐのに役立つ5つのAIスキル(5 AI Skills That Can Help You Earn $150K–200K as an AI Engineer)
(1)AIエンジニアとして15-20万ドルを稼ぐのに役立つ5つのAIスキル(5 AI Skills That Can Help You Earn $150K–200K as an AI Engineer)
先端技術情報20261010
非・民主制国家のデフレーション(前編)
ビットコインが再び暴落している。ほとんどの投資家が常に誤解していることは以下の通りである。(Bitcoin Is Crashing Again. Here’s What Most Investors Always Get Wrong.)
ヒーローは決して現れない(そして、おそらくそれが核心なのだ)The Hero Never Arrives (And Maybe That’s the Point)
Comments
東武鉄道6号機関車、…
 New!
GKenさん
New!
GKenさん2026年10月11日…
New!
藻緯羅さん源氏物語〔38帖 鈴虫…
New!
USM1さん英語に未来時制って…
samito07さんCategory
カテゴリ未分類
(112)連絡
(24)交流会
(27)セミナー
(29)参考情報
(138)オフ会
(36)on-line報告会
(13)翻訳ビジネス
(8)情報開発
(270)ビッグデータ
(89)ブロックチェーン
(255)人工知能
(579)IOT
(309)仮想通貨
(882)コンテンツ
(132)政治経済
(2020)先端技術
(987)DITA
(53)テレワーク
(28)UX
(0)文書管理
(9)テクニカルライテイング
(29)学習
(9)訓練
(1)XMLソリューション
(3)メタバース
(101)Web3
(69)投資
(211)IoT
(34)投資信託
(1)ビットコイン
(844)イーサリアム
(166)NFT
(41)オンライン
(0)受動収入
(14)ソーシャルメデイア
(0)DAO
(2)DeFi
(85)暗号通貨
(168)トークノミクス
(23)アルトコイン
(234)空中投下
(16)スマート契約
(4)ステーブルコイン
(44)金
(5)生成AI
(5)SCM
(4)ウオレット
(9)不労所得
(60)セキュリテイ
(4)ミームコイン
(51)CBDC
(5)PoS
(3)PoW
(1)ETF
(15)仮想通貨ETF
(1)予言
(7)裁定取引
(1)GameFi
(5)マイニング
(11)RWA
(25)DePIN
(22)SWFT
(1)WLFI
(1)アービトラージ
(7)XRP
(69)大統領選
(4)BCH
(1)取引ボット
(17)トレーデイング
(56)不動産
(1)詐欺
(4)貿易戦争
(1)医療
(1)金融
(2)TEZOS
(1)CARDANO
(2)カルダーノ
(3)ステーキング
(5)チェーンリンク
(1)開発
(0)HEDERA
(4)スマートマネー
(0)流動性
(0)AIエージェント
(26)401k
(1)国際送金
(1)solano
(1)AI
(1)暗号資産
(102)機関投資家
(5)量子コンピューター
(8)AIエージェント
(8)ドキュメンテーション
(2)AIトレーデイング
(1)トークン化株式
(2)半導体
(1)フリーランス
(1)Keyword Search
Freepage List


Shopping List

MACD (Moving Average Convergence Divergence):
MACD
(移動平均収束拡散法)
The Basics
基本
The MACD indicator is one of the most complicated momentum indicators and the favorite of many investors. The main use of MACD is to help investors identify strong entry points
. This
indicator consists of three
main components: The MACD line, the signal line and the histogram.
MACD
インジケーターは、最も複雑なモメンタムインジケーターの
1
つであり、多くの投資家のお気に入りです。
MACD
の主な用途は、投資家が強力な参入ポイントを特定するのを支援することです。この指標は、
MACD
ライン、シグナルライン、ヒストグラムの
3
つの主要コンポーネントで構成されています。
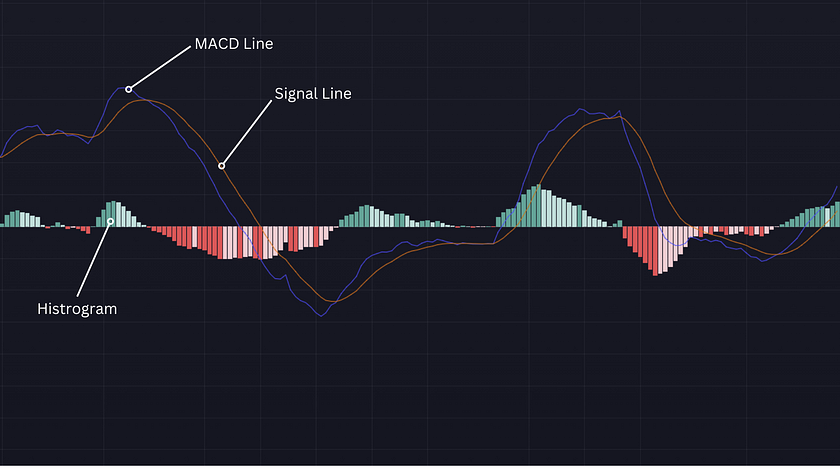
MACD Line, Signal Line, Histogram
MACD
ライン、シグナルライン、ヒストグラム
The Components in Depth
構成要素の詳細
The Signal line
represents the 9EMA.
It is usually plotted over the MACD line and can be a helpful tool to spot reversals
.
シグナルラインは
9EMA
を表しています。通常、
MACD
ライン上にプロットされ、反転を見つけるのに役立つツールになります。
The MACD line
is calculated from subtracting
the 26EMA
from the 12EMA;
so if the difference of these two values is a positive
number the MACD line will be above zero.
This signals good market conditions.
On the other hand if the difference results in a negative
number the line will slip below zero
signaling a down-trend
.
MACD
ラインは、
12EMA
から
26EMA
を差し引いて計算されます。したがって、これら
2
つの値の差が正の数の場合、
MACD
ラインは
0
より大きくなります。これは、良好な市況を示しています。一方、差が負の数になると、線はゼロを下回り、下降トレンドを示します。
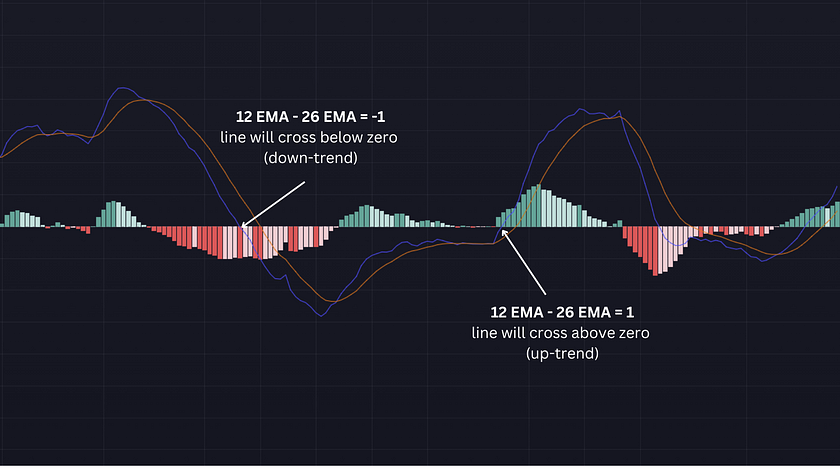
MACD line crossing above and below zero.
ゼロの上下に交差する
MACD
ライン。
The Histogram
shows the distance
between the MACD line and the signal line. When the MACD line is above the signal line, green bars are
formed and when it's below the signal line, red
bars are formed. The length of the bar portrays the strength of the trend. Long
bars
indicate strong trends
, and short bars
indicate weak trends
. The gradient of the bars can also represent the direction
of the market. Multiple light bars
mean the trend is dying
out
.
ヒストグラムは、
MACD
ラインとシグナルラインの間の距離を示します。
MACD
ラインがシグナルラインより上にある場合、緑色のバーが形成され、その下にある場合、シグナルラインの赤いバーが形成されます。バーの長さは、トレンドの強さを表しています。長いバーは強いトレンドを示し、短いバーは弱いトレンドを示します。バーのグラデーションは、市場の方向を表すこともできます。複数の明るいバーは、トレンドが消えかけていることを意味します。
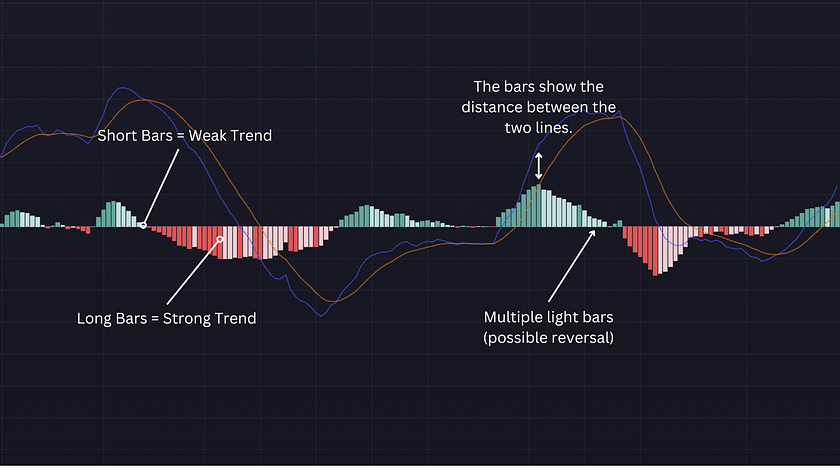
The Histogram
shows the distance
between
the MACD line and the signal line.
ヒストグラムは、
MACD
ラインとシグナルラインの間の距離を示しす。
Identifying Entry Points
参入ポイントの特定
The MACD indicator can be much quicker at spotting reversals
in compassion to moving averages. Although MACD will also form crossovers in small price changes
(under
2%).
MACD
インジケーターは、移動平均線に対する反転をはるかに迅速に見つけることができます。
MACD
は、小さな価格変動
(2%
未満
)
でもクロスオーバーを形成しますが。
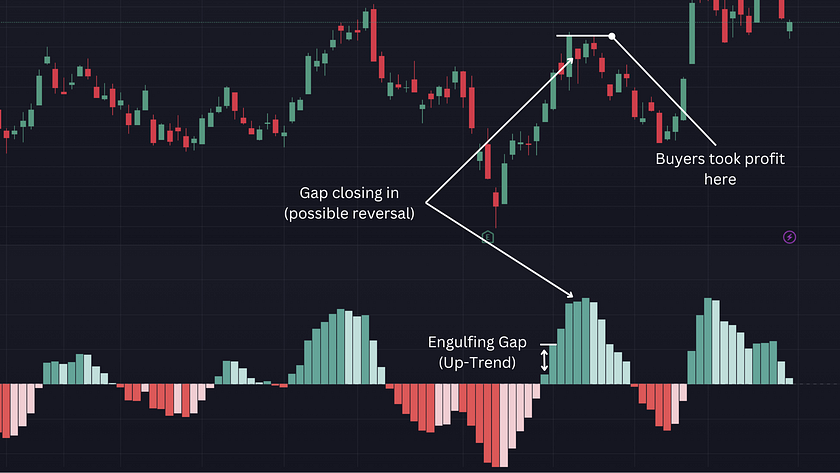
The Histogram
is mainly used to identify trends in the market. When the chart shows engulfing dark bars
it can signal strong entry points and a trend with strong momentum. The gap from one bar to another should gradually be increasing
; if the gap starts to decrease in distance it can indicate loss of momentum
and even a possible reversal. After significant buying pressure it is is common for the buyers to reach their “
take profit
”
. When this level is reached sellers begin to dominate and the color of the bars can turn into a lighter
gradient
or the gap between dark bars can began to close off.
ヒストグラムは、主に市場のトレンドを特定するために使用されます。チャートに包み込むような暗いバーが表示されている場合、それは強いエントリーポイントと強い勢いのあるトレンドを示している可能性があります。
1
つのバーから別のバーへのギャップは徐々に増加しているはずです。ギャップが距離が短くなり始めた場合、それは勢いが失われ、さらには逆転の可能性を示している可能性があります。大きな買い圧力の後、買い手が「利益を得る」のは一般的です。このレベルに達すると、売り手が支配的になり始め、バーの色が明るいグラデーションに変わるか、暗いバー間のギャップが閉じ始める可能性があります。
Histograms can often start to make many false calls when the market begins to move sideways. To avoid this it is best to stay out of trades when the histogram is surfing the 0 line
.
ヒストグラムは、市場が横ばいに動き始めると、多くの誤った呼び出しをし始めることがよくあります。これを回避するには、ヒストグラムが
0
ラインをサーフィンしているときに取引から離れるのが最善です。
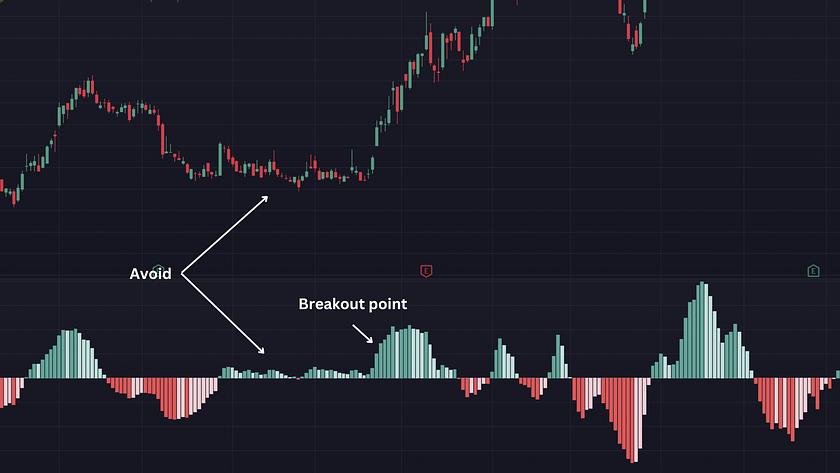
The breakout point formed after 3 engulfing dark bars (bigger in size than pervious).
大ブレークポイントは、
3
つの包み込む暗いバー
(
前のバーよりも大きい
)
の後に形成される。
The MACD line
and the Signal line
are used to spot reversals. This usually happens when the two lines cross through one another or through the 0 mark. These lines can also be used to spot support and resistance areas
.
MACD
ラインとシグナルラインは、反転を見つけるために使用されます。これは通常、
2
本の線が互いに交差するか、
0
マークを通過するときに発生します。これらの線は、サポートエリアとレジスタンスエリアを見つけるためにも使用できます。
If the lines continuously bounces back up
after reaching a certain point this area can be marked as a support zone
. This place is used to spot dying trends
as whenever the price reaches here buyers put more pressure into the market. The same analogy can be used to form resistance areas
as sellers begin to put more pressure when the lines reach their swing-high
. This strategy doesn't reflect the area in which the price immediately bounces back
, rather the signal a reversal is approaching.
特定のポイントに達した後、ラインが継続的に跳ね返る場合、この領域をサポートゾーンとしてマークできます。この場所は、価格がここに到達するたびに、買い手が市場により多くの圧力をかけるため、死にかけている傾向を見つけるために使用されます。同じ例えを使用して、ラインがスイングハイに達したときに売り手がより多くの圧力をかけ始めるため、抵抗領域を形成することができます。この戦略は、価格がすぐに跳ね返る領域を反映しているのではなく、反転が近づいているシグナルを反映しています。
Immediate entry points are formed when the MACD line crosses
with the Signal line. This method is only effective in extremely trendy markets
. This means the price must make big moves in a very short time frame. Trading safe with MACD means to only secure buy entry's
when both lines are either at or
below the 0 mark
. On the other hand, only secure sell entry's
when both lines are either at or
above the 0 mark
.
MACD
ラインがシグナルラインと交差すると、即時参入ポイントが形成されます。この方法は、非常にトレンディな市場でのみ有効です。これは、価格が非常に短い時間枠で大きな動きをしなければならないことを意味します。
MACD
で安全に取引するということは、両方のラインが
0
マークにあるかそれ以下の場合にのみ買い参入確保を意味します。一方、安全な売り参入は、両方のラインが
0
マーク以上にある場合にのみ行います。
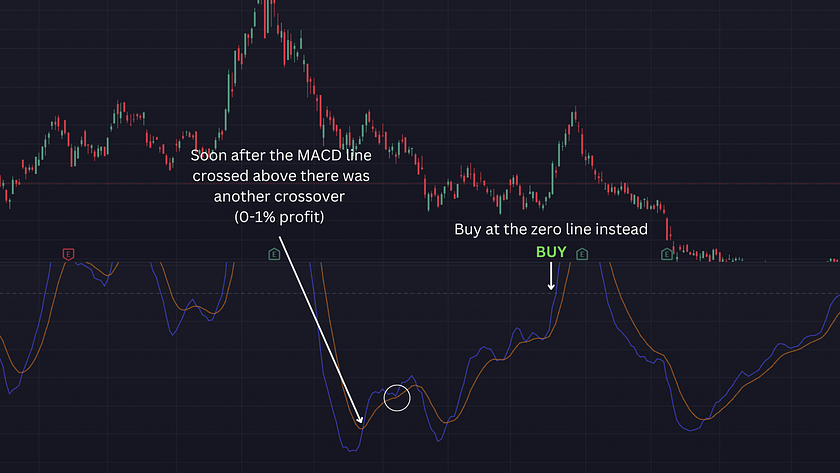
When the MACD line crosses above
the Signal line it is an area to buy. When the MACD line crosses below
the Signal line it is an area to sell.
MACD
ラインがシグナルラインを上回ると、買いのエリアになります。
MACD
ラインがシグナルラインを下回ると、売りになるエリアです。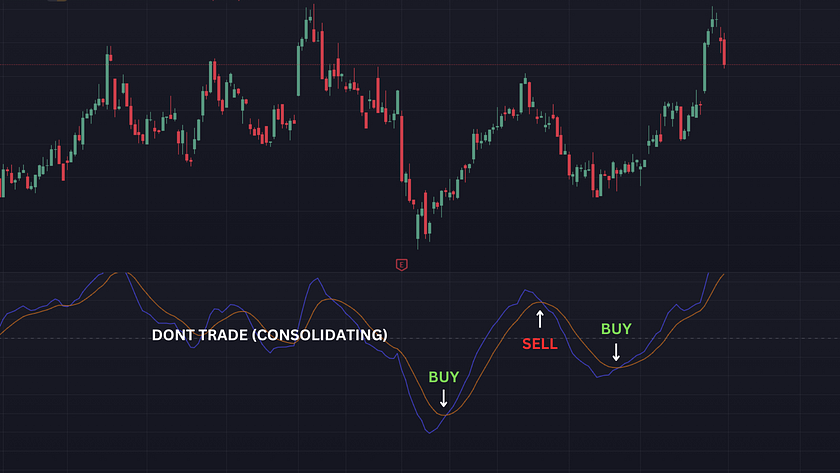
Although, this method can sometimes results in small success rates when the market is unstable,
which causes price to drop back soon after crossing. A safter option can be to set a buy entry when the MACD line crosses the 0 mark
which often results in a confirmed profit.
ただし、この方法では、市場が不安定な場合、成功率が小さくなることがあり、交差するとすぐに価格が下落します。スアフターオプションは、
MACD
ラインが
0
マークを横切ったときに買いエントリーを設定することであり、これにより多くの場合、利益が確認されます。
Divergences In MACD
MACD
の乖離
Divergences occurs when the price and the indicator are not in agreement (indicating reversal).
乖離は、価格と指標が一致していない
(
逆転を示す
)
場合に発生します。
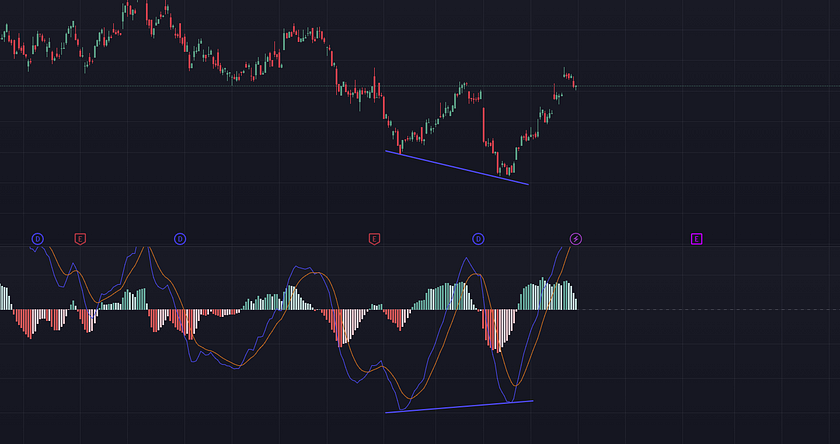
This is an example of a bullish divergence. The chart clearly shoes a “lower low”
, while the MACD line reads a “higher high”
. The shape of these two lines forms an inclosing wedge and this divergence causes a big uptrend.
これは強気の乖離の一例です。チャートは明らかに「安値を下げる」のに対し、
MACD
の線は「高値」を示しています。これらの
2
本の線の形状は、閉じ込めるくさびを形成し、この乖離は大きな上昇トレンドを引き起こします。

This is an example of a bearish divergence. The chart clearly shoes a “higher high”
, while the MACD line reads a “lower low”
. The shape of these two lines forms an outward wedge
and this divergence causes a big downtrend.
これは弱気の乖離の一例です。チャートは明らかに「高値」を示し、
MACD
ラインは「安値の下値」を示しています。これらの
2
本の線の形状は外側のくさび形を形成し、この乖離は大きな下降トレンドを引き起こします。
インターネット・コンピュータランキング
==============================
ネットサービスランキング
==============================
![[商品価格に関しましては、リンクが作成された時点と現時点で情報が変更されている場合がございます。]](https://hbb.afl.rakuten.co.jp/hgb/3bd6b821.79536051.3bd6b822.17595506/?me_id=1319096&item_id=10000885&pc=https%3A%2F%2Fthumbnail.image.rakuten.co.jp%2F%400_mall%2Fsoo-ya%2Fcabinet%2Fchuukopc%2F06999677%2F09458120%2Frakutenn-000q5.jpg%3F_ex%3D240x240&s=240x240&t=picttext "[商品価格に関しましては、リンクが作成された時点と現時点で情報が変更されている場合がございます。]")

![[商品価格に関しましては、リンクが作成された時点と現時点で情報が変更されている場合がございます。]](https://hbb.afl.rakuten.co.jp/hgb/08733d95.84a0fd0f.08733d96.10216c18/?me_id=1213310&item_id=20993568&pc=https%3A%2F%2Fthumbnail.image.rakuten.co.jp%2F%400_mall%2Fbook%2Fcabinet%2F5563%2F4549576215563.jpg%3F_ex%3D240x240&s=240x240&t=picttext "[商品価格に関しましては、リンクが作成された時点と現時点で情報が変更されている場合がございます。]")
Xbox Series S 1TB (ブラック)
価格:44,577円(税込、送料無料) (2024/5/5時点)
![[商品価格に関しましては、リンクが作成された時点と現時点で情報が変更されている場合がございます。]](https://hbb.afl.rakuten.co.jp/hgb/3bd25767.ee8833bd.3bd25768.a1caa8f0/?me_id=1338494&item_id=10000034&pc=https%3A%2F%2Fthumbnail.image.rakuten.co.jp%2F%400_mall%2Fsmoothskin%2Fcabinet%2Fproduct-image%2Fbare%2F01bareplus1.jpg%3F_ex%3D240x240&s=240x240&t=picttext "[商品価格に関しましては、リンクが作成された時点と現時点で情報が変更されている場合がございます。]")
![[商品価格に関しましては、リンクが作成された時点と現時点で情報が変更されている場合がございます。]](https://hbb.afl.rakuten.co.jp/hgb/3bd2593c.b905c7af.3bd2593d.2d0f3c0f/?me_id=1389200&item_id=10000977&pc=https%3A%2F%2Fthumbnail.image.rakuten.co.jp%2F%400_mall%2Fjustrich%2Fcabinet%2F10503145%2Fimgrc0121023915_1.jpg%3F_ex%3D240x240&s=240x240&t=picttext "[商品価格に関しましては、リンクが作成された時点と現時点で情報が変更されている場合がございます。]")
エアラブ4 ベビーカー シート ベビーカー 扇風機 夏 保冷剤 冷感 保冷 チャイルドシート 出産祝い 冷却 保冷シート ベビーシート 赤ちゃん シートファン クーラーファンシート 暑さ対策 ひんやり ファン付シート
価格:11,800円~(税込、送料無料) (2024/5/1時点)
![[商品価格に関しましては、リンクが作成された時点と現時点で情報が変更されている場合がございます。]](https://hbb.afl.rakuten.co.jp/hgb/3afcaeb9.0e6d0618.3afcaeba.5c084c8e/?me_id=1371293&item_id=10000071&pc=https%3A%2F%2Fthumbnail.image.rakuten.co.jp%2F%400_mall%2Fsunshine-osaka%2Fcabinet%2F09337950%2Febi100samuneru02.jpg%3F_ex%3D240x240&s=240x240&t=picttext "[商品価格に関しましては、リンクが作成された時点と現時点で情報が変更されている場合がございます。]")
60%以上えび(具)海老 エビ えび 一龍堂 餃子 ぎょうざ ギョウザ ギョーザ 100個 えび餃子 海老餃子 冷凍 生餃子 冷凍食品 冷凍餃子 送料無料 鮮度抜群 ぷりぷり 惣菜 中華惣菜 中華点心 人気 極上 贅沢
価格:7,960円(税込、送料無料) (2024/5/1時点)
![[商品価格に関しましては、リンクが作成された時点と現時点で情報が変更されている場合がございます。]](https://hbb.afl.rakuten.co.jp/hgb/3bd25c5a.f5ae1e6f.3bd25c5b.9072cadb/?me_id=1338178&item_id=10000015&pc=https%3A%2F%2Fthumbnail.image.rakuten.co.jp%2F%400_mall%2Fmashiro%2Fcabinet%2F82xsakura%2Fthumb%2Fimgrc0106198089.jpg%3F_ex%3D240x240&s=240x240&t=picttext "[商品価格に関しましては、リンクが作成された時点と現時点で情報が変更されている場合がございます。]")
![[商品価格に関しましては、リンクが作成された時点と現時点で情報が変更されている場合がございます。]](https://hbb.afl.rakuten.co.jp/hgb/3c5b7654.02273dfa.3c5b7655.0ebf4fa0/?me_id=1396705&item_id=10001358&pc=https%3A%2F%2Fthumbnail.image.rakuten.co.jp%2F%400_mall%2Fkrdirect%2Fcabinet%2Fnewpc%2Fn95j_01_.jpg%3F_ex%3D240x240&s=240x240&t=picttext "[商品価格に関しましては、リンクが作成された時点と現時点で情報が変更されている場合がございます。]")
![[商品価格に関しましては、リンクが作成された時点と現時点で情報が変更されている場合がございます。]](https://hbb.afl.rakuten.co.jp/hgb/08733d95.84a0fd0f.08733d96.10216c18/?me_id=1213310&item_id=21407346&pc=https%3A%2F%2Fthumbnail.image.rakuten.co.jp%2F%400_mall%2Fbook%2Fcabinet%2F6320%2F4948872416320.jpg%3F_ex%3D240x240&s=240x240&t=picttext "[商品価格に関しましては、リンクが作成された時点と現時点で情報が変更されている場合がございます。]")
PlayStation5 Pro
価格:119,980円(税込、送料無料) (2024/10/2時点)
![[商品価格に関しましては、リンクが作成された時点と現時点で情報が変更されている場合がございます。]](https://hbb.afl.rakuten.co.jp/hgb/40927f2a.4345bc29.40927f2b.8092e0f6/?me_id=1379988&item_id=10003150&pc=https%3A%2F%2Fthumbnail.image.rakuten.co.jp%2F%400_mall%2Ff016918-betsukai%2Fcabinet%2F07065206%2Fmaruhiro%2Fimgrc0096113695.jpg%3F_ex%3D240x240&s=240x240&t=picttext "[商品価格に関しましては、リンクが作成された時点と現時点で情報が変更されている場合がございます。]")
【ふるさと納税】24年上半期 総合1位 ホタテ ふるさと 納税 訳あり 選べる2サイズ 1kg 2kg 3kg 4kg 【発送時期が選べる】( ふるさと納税 ほたて ランキング 海鮮 ふるさと納税 帆立 北海道 別海町 人気 ホタテ貝柱 緊急支援品 北海道別海町 冷凍 貝 )
価格:12,000円~(税込、送料無料) (2024/10/2時点)

-
ウォーレン・バフェットが株式を評価する… 2026.10.11
-
着実な勝利のためのテクニカル分析パター… 2026.10.09
-
乱高下の大きい市場における賢いポートフ… 2026.10.09


