

Drill actions can make charts more interactive, reduce the number of charts in a report, and make it easier for users to find additional context about data.
For example, suppose you want to view session data by both country and city. Rather than include two charts in your report, you can include a single chart with drill actions enabled.
This page provides an overview of the different types of drill actions in Looker Studio and how to implement them in charts.
For more information about how to use drill actions when viewing reports, view the Drill into your data tutorial page.
Drill actions in Looker Studio
Drill actions let you view levels of detail and more context about the data in a chart.
There are several types of drill actions:
-
The Drill Downdrill action lets users drill from a higher level of detail to a lower one (for example, drill down from Countryto City) and from a lower level of detail to a higher one (for example, drill up from Cityto Country).
The Drill Downsetting also lets users change or swap the dimensions that are on a report. For example, if Country, State, and Cityare available drill fields, a user can swap between them on a chart to break down metrics for a different granularity without drilling up or drilling down.
-
The Drill Throughdrill action lets users navigate to related content with a preset URL.
Table chart drill actions example
In table charts, drill actions are presented to users in the tooltip that appears when they put their cursor over a data point in a chart.
For example, if a user puts their cursor over the state Californiain table chart that displays FAA flight count by destination, they can click the Drill actionsoption to see the options that are available for drilling into the data.
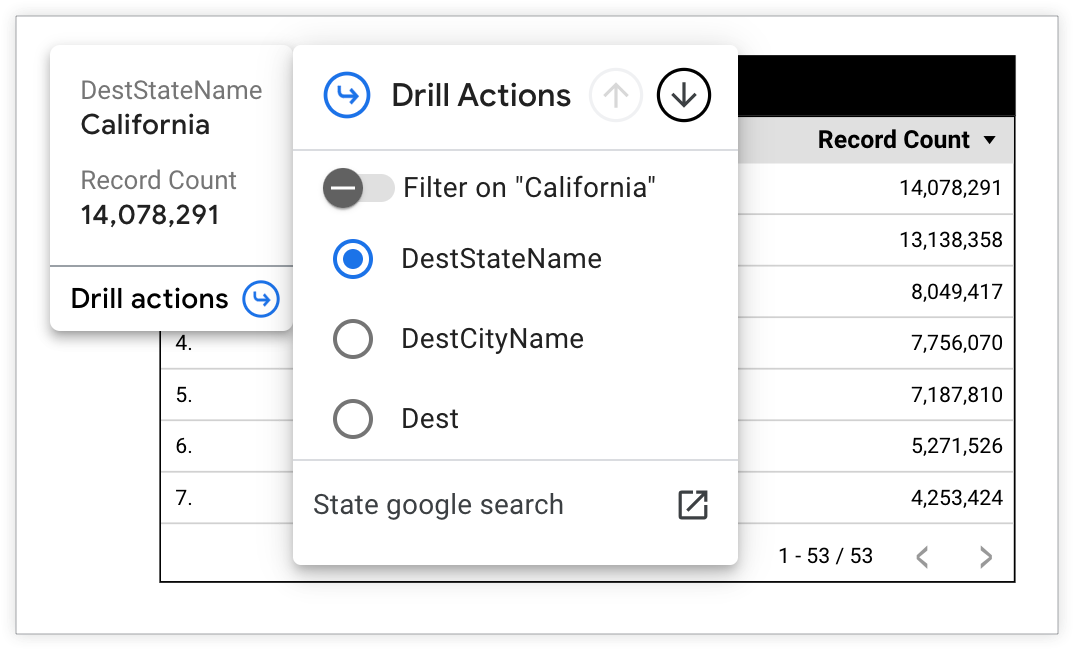
The user can then take one of several actions. For example:
-
The user can swap the DestStateNamedimension for either the DestCityNameor Destdimensions to display the Record Countaggregations for cities or airports instead of states.
-
The user can turn on the Filter on "California"switch to limit the chart results to California.
-
The user can click the up and down arrows in the Drill Actionsmenu header to switch the level of granularity on a chart.
-
The user can turn on the Filter on "California"switch to display more granular record counts for DestCityNameor Destthat are in California.
-
The user can click State Google searchto drill through to a Google search for more context about a state.
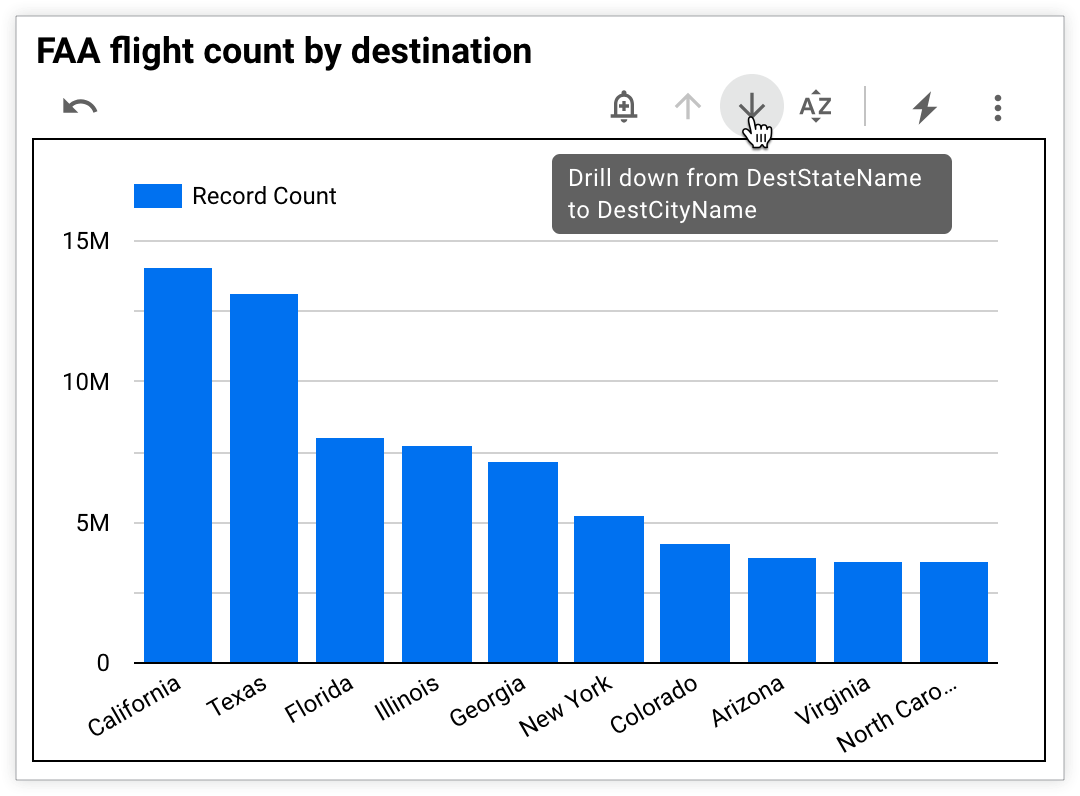
Column chart drill actions example
In other chart types, such as column charts , users can drill up or drill down by using one of these options:
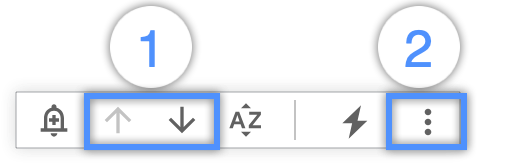
- The Drill upand Drill downarrows that appear in a chart's header when a user puts their cursor over a chart
- The Drill upor Drill downoptions in the three-dot Moremenu that appears in a chart's header when a user puts their cursor over a chart
Alternatively, Drill upor Drill downoptions are available when a user right-clicks on a chart.
For example, if a user clicks the Drill downarrow in a column chart that displays FAA flight count by destination state, the chart will display the chart data for the next dimension that is defined in the drill hierarchy, which is DestCityName.
Requirements for the Drill Down drill action
To add drill down capability to a chart, you need to define a dimension hierarchy. The hierarchy specifies the levels of detail that a chart can display when users drill down or up. Example hierarchies include the following:
- Date (Year, Month, Day)
- Geography (Country, Region, City)
- Product (Department, Category, SKU)
- Google Analytics events (Event Category, Event Action, Event Label)
Add drill actions to table charts
Adding drill actions is different for table charts than for other types of charts.
Add a Drill Down action to table charts
To add the Drill Downdrill action to table charts, follow these steps:
- Edit your report .
- Add a new chart or select an existing chart.
- In the Propertiespanel, click the Setuptab.
- In the Dimensionsection, click the field's data type icon to edit the field .
- Click Add Drill Actionto open the Add Drill Actionmenu.
- In the Drill Downsection, click and place dimensions from the Datapanel or click + Add Fieldto add dimensions. Each dimension that you add becomes another level of detail that users can drill into or swap on a chart. You can change the order of dimensions by dragging and dropping the dimensions that are listed in the Drill Downsection to set the drill hierarchy .
- Click the Applybutton at the bottom of the Add Drill Actionmenu.
Edit or remove Drill Down fields from table charts
To edit or remove drill down fields from a table chart, follow these steps:
-
Select the chart that you want to edit.
-
In the Propertiespanel, click the Setuptab.
-
In the Dimensionsection, click the field's data type icon to edit the field .
-
Click Add Drill Actionto open the Add Drill Actionmenu.
-
In the Drill Downsection, you can edit or remove drill fields.
-
To editfields, click and place dimensions from the Datapanel or click + Add Fieldto add additional dimensions. You can also change the order of dimensions by dragging and dropping the dimensions that are listed in the Drill Downsection.
-
To removea field, put your cursor over a field name, and click the inline Xicon that appears.
-
-
Click the Applybutton at the bottom of the Add Drill Actionmenu.
Add Drill Through links to table charts
To enable the Drill Throughdrill action for table charts, follow these steps:
-
Add a new chart or select an existing chart.
-
In the Propertiespanel, click the Setuptab.
-
In the Dimensionsection, click the field's data type icon to edit the field .
-
Click Add Drill Actionto open the Add Drill Actionmenu.
-
In the Drill Throughsection next to Drill Through Link, click + Add URLto expand the drill through link customization options.
-
In the Display Nametext field, enter the descriptive text that you would like users to see in the Drill actionsmenu of a chart tooltip. For example, if you link to a related Salesforce page, you can set the display text to "Navigate to Salesforce".
-
In the URLtext field, enter the webpage URL.
-
Click the Savebutton to save your settings. Alternatively, you can click Cancelto close the customization options for the drill through link.
-
To add additional drill through links, repeat steps 6 through 9.
-
Click the Applybutton at the bottom of the Add Drill Actionmenu.
Edit or remove Drill Through links from table charts
To edit or remove drill through links from a table chart, follow these steps:
-
Select the chart that you want to edit.
-
In the Propertiespanel, click the Setuptab.
-
In the Dimensionsection, click the field's data type icon to edit the field .
-
Click Add Drill Actionto open the Add Drill Actionmenu.
-
In the Drill Throughsection, you can edit or remove links.
-
To edit alink, select the link name to expand the drill through link customization options. Make any changes to the Display Nameor URLfields.
-
To removea URL, select the link name to expand the drill through link customization options and click the trash can icon.
-
-
At the bottom of the Add Drill Actionmenu, click the Applybutton.
Add drill actions to other chart types
To add drill actions to other charts, follow these steps:
-
Add a new chart or select an existing chart.
-
In the Propertiespanel, click the Setuptab.
-
In the Dimensionsection, turn on the Drill downswitch to expand the drill options section.
-
Click and place dimensions from the Datapanel or click + Add Fieldto add dimensions to the Dimensionsection. Each dimension that you add becomes another level of detail that you can drill into.
You can change the order of dimensions by dragging and dropping the dimensions that are listed in the Dimensionsection to set the drill hierarchy .
-
Select a dimension from the Default drill down leveldrop-down menu to set a default dimension for the chart.
Edit or remove drill actions from other chart types
To turn off drill actions for other charts, follow these steps:
-
Select the chart that you want to edit.
-
Click the Setuptab in the Propertiespanel.
-
In the Dimensionsection, you can edit or remove drill fields or turn off drill actions.
-
To editdrill fields, click and place dimensions from the Datapanel or click + Add Fieldto add additional dimensions. You can also change the order of dimensions by dragging and dropping the dimensions that are listed in the Dimensionsection.
Additionally, you can select a different dimension from the Default drill down leveldrop-down menu to change the default dimension for the chart.
-
To removea field, put your cursor over a field name, and click the inline Xicon that appears.
-
To turn offdrill actions, turn off the Drill downswitch.
-
Drill action limitations and considerations
-
Drill actions are not available for community visualizations.
-
Drill actions are not available for dimensionless charts such as scorecards and bullet charts.
-
Drill fields and links that are imported from Looker data sources are read-only. To make changes to imported drill actions, edit the underlying LookML model in Looker.
-
You can see additional levels of detail in pivot tables by turning on expand-collapse. You can then show or hide the data from the dimension hierarchy in the pivot table by clicking +and –in the column header. Learn more about pivot tables .
-
Geo charts don't support all geographic field types within all zoom areas. See the Geo chart reference for more details.