

Drilling is a powerful tool that lets you view more information and context about data in a single chart. Drilling lets you discover new levels of detail about a data point, see other related and contextual information, and take action based on the information you find.
For example, suppose you want to view session data both by country and by city. Rather than viewing two charts in your report, you can reference a single chart that has drill actions enabled.
This document provides an overview of how to use drill actions in charts and includes use cases and examples. For more information about setting up drill actions, view the Add drill actions to charts page.
Access drill actions on table charts
You can access drill actions in a chart's Drill Actionsmenu. To access the drill actions that are on the Drill Actionsmenu, follow these steps:
-
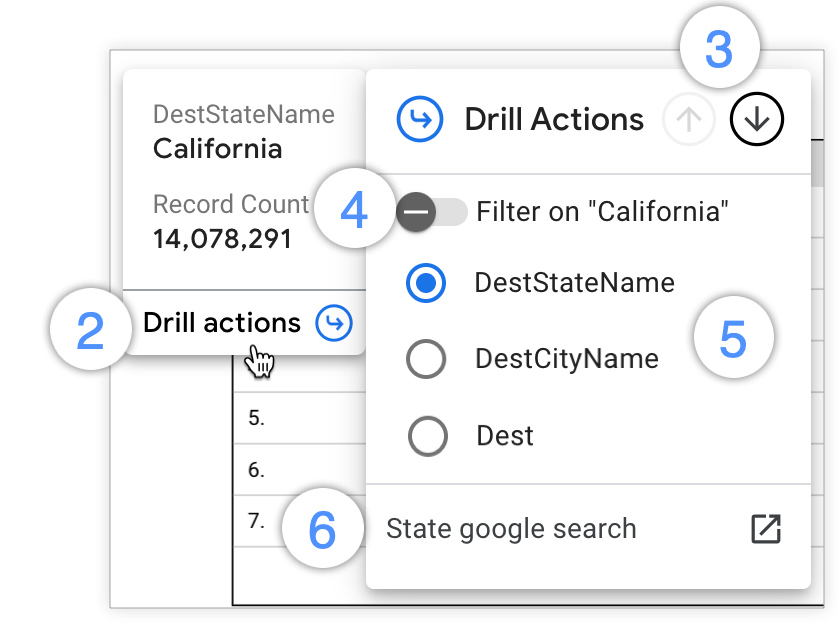
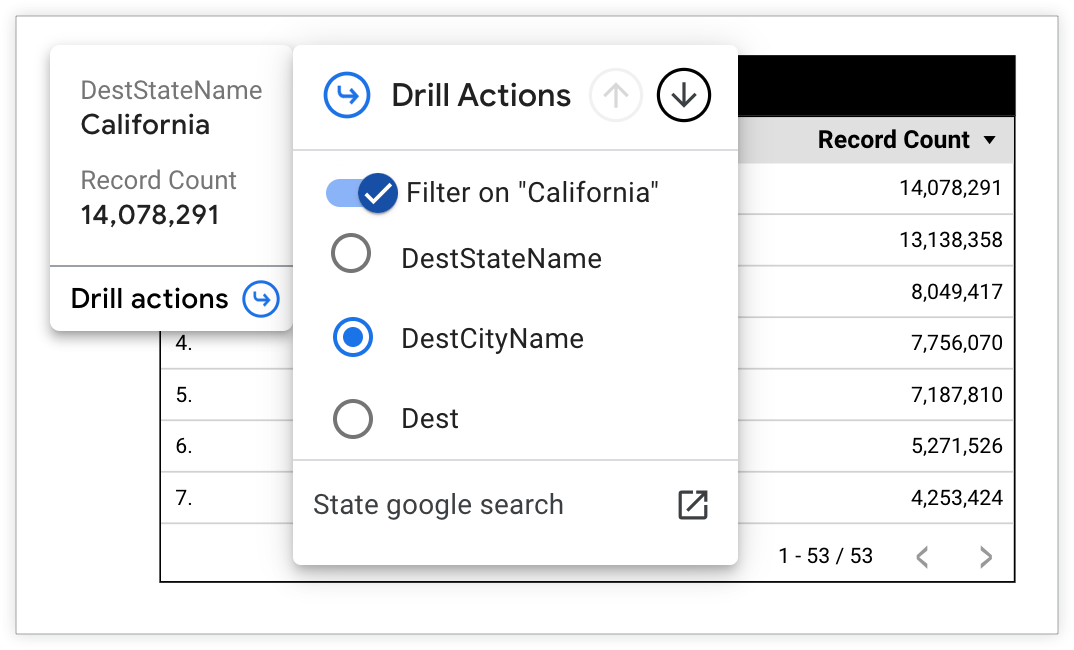
Hold the pointer over a dimension value in the table chart. For example, a user can hover over the value "California" for a table chart with a state name dimension called DestStateName.
-
Click Drill actionson the tooltip to open the Drill Actionsmenu.
Once you open the Drill Actionsmenu, you can drill in several ways:
-
Click the upward-facing Drill Uparrow to drill up and the downward-facing Drill Downarrow in the Drill Actionsmenu header to change the granularity of the chart's data.
-
Turn on the Filter onswitch to drill down into a specific value that you want to learn more about.
-
Select the available dimensions that are listed in the Drill Actionsmenu to drill down, drill up, or swap dimensions.
-
Click the links that appear at the bottom of the Drill Actionsmenu to navigate to external related resources.
Drill down, drill up, and swap dimensions on table charts
You can drill down into a dimension and swap it for a more granular dimension on a table chart. To drill down into your data and swap a dimension with a more granular dimension, follow these steps:
-
View or edit your report .
-
Choose a table chart that has drill-down capabilities.
-
Hover your cursor over a dimension value in the chart to view the tooltip.
-
Click Drill actionsat the bottom of the tooltip to open the Drill Actionsmenu.
-
At the top of the Drill Actionsmenu, click the downward-facing Drill Downarrow. Alternatively, select a dimension from the Drill Actionsdimension list.
-
Click outside of the Drill Actionsmenu to save your selection and view the chart results.
-
You can drill back up on a table chart and swap it with a less granular dimension by selecting the upward-facing Drill Uparrow at the top of the Drill Actionsmenu. Alternatively, you can select a less granular dimension from the Drill Actionsdimension list.
To restore the chart to the default (highest) drill down level, you can hover your cursor over the chart and select the Resetarrow![]() in the chart's header. Alternatively, select the Resetoption from the chart's three-dot Moremenu.This will also reset any filters or manual sorting that you've applied to the chart.
in the chart's header. Alternatively, select the Resetoption from the chart's three-dot Moremenu.This will also reset any filters or manual sorting that you've applied to the chart.
Example: Drill down to see all cities
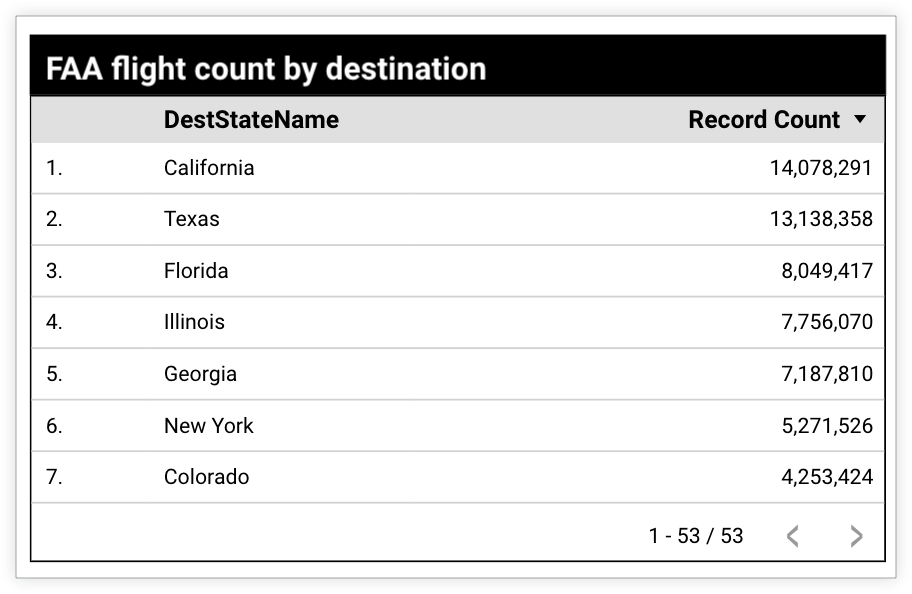
Suppose you have a table chart that displays FAA flight count by destination state. The chart has a drill-down hierarchy that is defined with the DestStateName(state), DestCityName(city), and Dest(airport code) dimensions. A user wants to view the flight Record Countbroken down by city instead of state. The user can swap the state dimension with city data by drilling down.
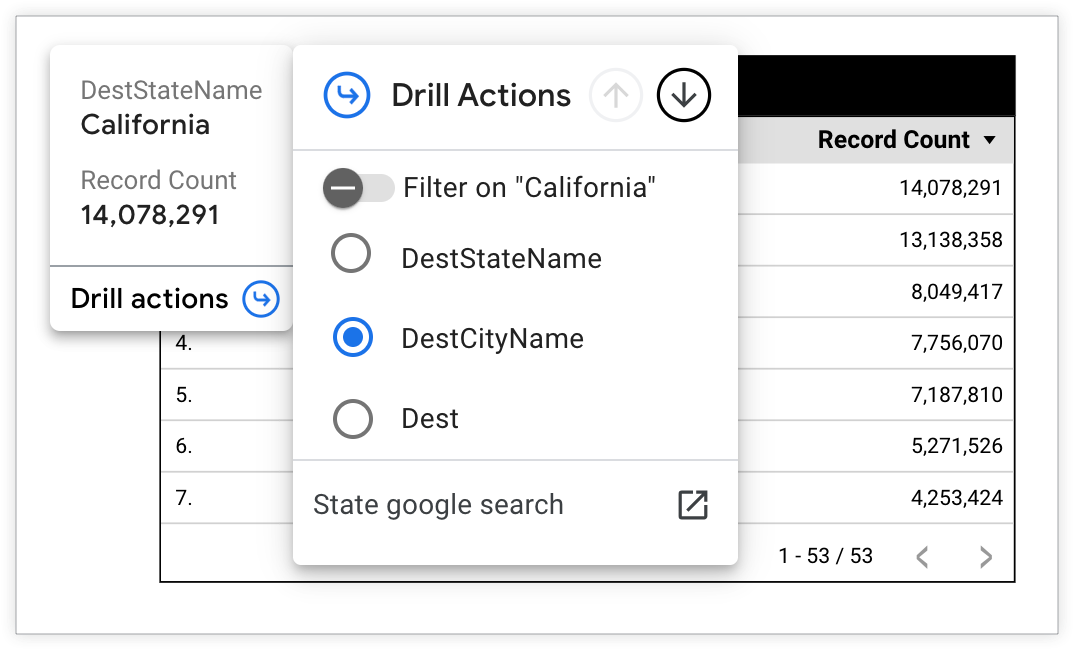
The user hovers their cursor over "California" in the results table to open the Drill Actionsmenu. They select DestCityNamefrom the list of drill fields.
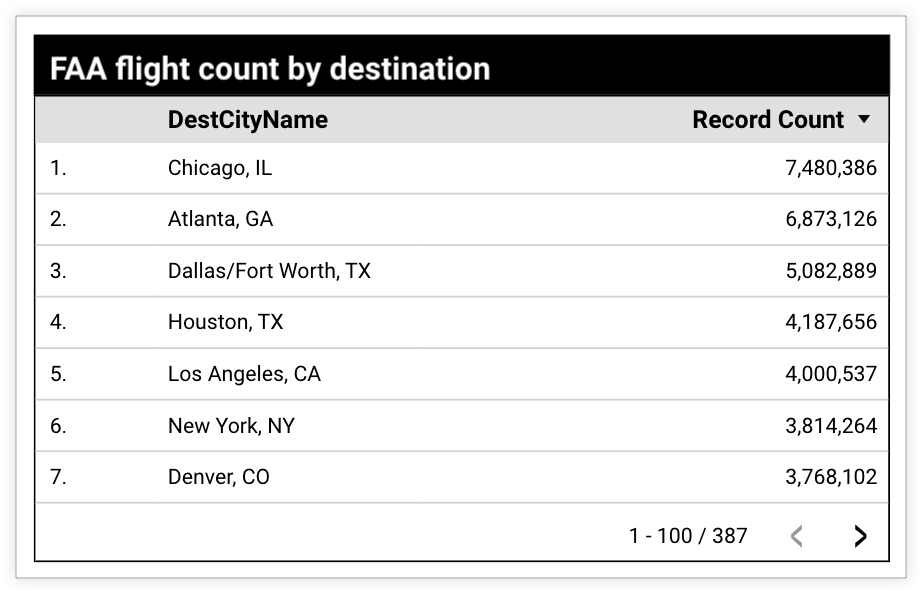
The table chart now displays flight Record Countby DestCityName, regardless of what state the city is located in.
Drill down into specific values on table charts
In addition to drilling down or swapping dimensions to view data by more granular dimensions, you can drill into an individual data point to learn more about the value.
To drill down into a selected value in a table chart, follow these steps:
-
View or edit your report .
-
Choose a table chart that has drill-down capabilities.
-
Hover your cursor over the dimension value that you want to drill into to view the tooltip.
-
Click Drill actionsat the bottom of the tooltip to open the Drill Actionsmenu.
-
Turn on the Filter onswitch.
-
Click the downward-facing Drill Downarrow at the top of the Drill Actionsmenu. Alternatively, select a dimension from the Drill Actionsdimension list.
-
Click outside of the Drill Actionsmenu to save your selection and view the chart results.
-
You can drill back up on a table chart by selecting the upward-facing Drill Uparrow at the top of the Drill Actionsmenu. Alternatively, you can select a less granular dimension from the Drill Actionsdimension list.
To restore the chart to the default (highest) drill-down level, you can hold your cursor over the chart and select the Resetarrow![]() in the chart's header. This will also reset any filters or manual sorting that you've applied to the chart.
in the chart's header. This will also reset any filters or manual sorting that you've applied to the chart.
Example: Drill down to see cities in a specific state
Suppose you have a table chart that displays FAA flight count by destination state. The chart has a drill-down hierarchy defined with the DestStateName(state), DestCityName(city) and Dest(airport code) dimensions. A user wants to view the flight Record Countbroken down by cities that are in the state of California.
The user can view flight Record Countfor cities in California by drilling down.
The user hovers their cursor over "California" in the results table to open the Drill Actionsmenu. They turn on the Filter on "California"switch and then select DestCityNamefrom the list of drill fields.
The table chart will display flight Record Countby DestCityNamefor cities that are in the state of California.
Access drill actions on other chart types
You can drill up or drill down on chart types other than table charts by using one of these options: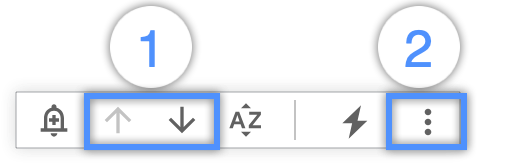
- The Drill U pand Drill Downarrows that appear in a chart's header when you hover your cursor over a chart\
- The Drill Upor Drill Downoptions in the three-dot Moremenu that appear in a chart's header when you hover your cursor over a chart
Alternatively, Drill upor Drill downoptions are available when a you right-click on a chart.
Drill down, drill up, and swap dimensions on other chart types
You can drill down into a dimension and swap it for a more granular dimension. To drill down into your data and swap a dimension with a more granular dimension:
-
View or edit your report .
-
Choose a chart that has drill-down capabilities.
-
Right-click the chart and click Drill Down. Alternatively, you can hover your cursor over the chart and either select Drill Downfrom the three-dot Moremenu or click the downward-facing arrow that appears in the chart's header.
-
You can drill back up on a chart by right-clicking the chart and selecting the Drill Upoption. Alternatively, you can hover your cursor over the chart and either select Drill Upfrom the three-dot Moremenu or click the upward-facing Drill Uparrow that appears in the chart's header.
To restore the chart to the default (highest) drill-down level, right-click the chart and then select the Reset actionoption. Alternatively, you can hover your cursor over the chart and select the Resetarrow![]() in the chart's header. This will also reset any filters or manual sorting you've applied to the chart.
in the chart's header. This will also reset any filters or manual sorting you've applied to the chart.
Example: Drill down to see all cities
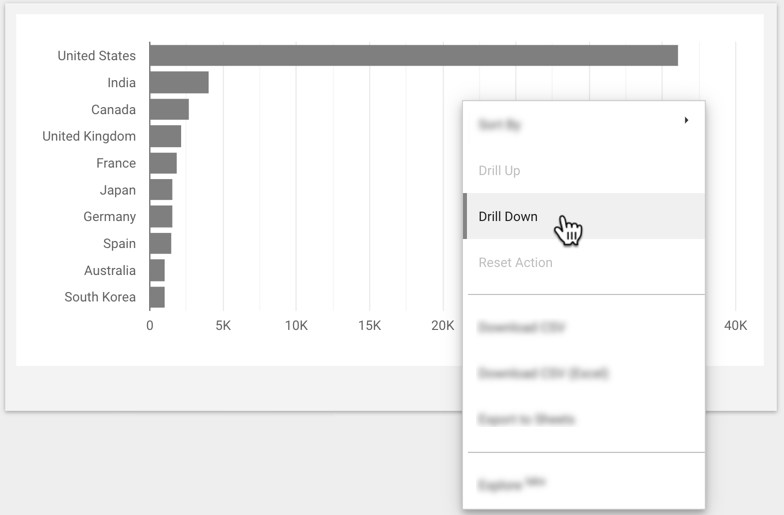
Suppose you have a bar chart that displays Sessionsby Country. The chart has a drill-down hierarchy defined for the Countryand Citydimensions. A user wants to view the Sessionsdata broken down by Cityinstead of Country. The user can swap the Countrydimension with Citydimension by drilling down.
The user right-clicks the chart and selects Drill Downfrom the menu options.
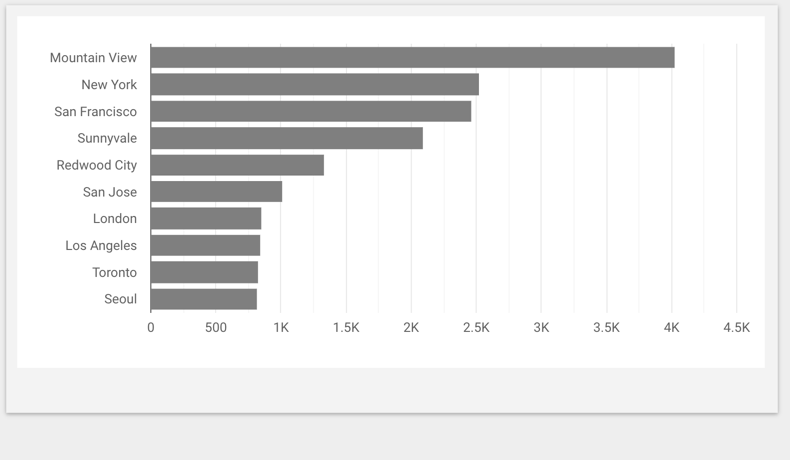
The bar chart now displays Sessionsby City, regardless of what country the city is located in.
Drill down into specific values on other chart types
In addition to drilling down or swapping dimensions to view data by more granular dimensions,, you can drill into an individual data point to learn more about the value.
To drill down into a selected value, follow these steps:
- View or edit your report.
- Choose a chart that has drill-down capabilities.
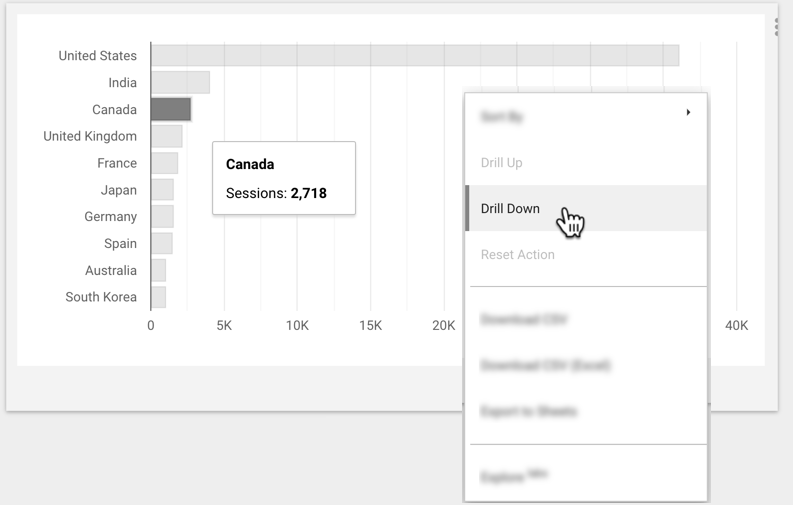
- Select a value (for example, Canada).
- Right-click the chart and then click Drill Down. Alternatively, you can hover your cursor over the chart and either select Drill Downfrom the three-dot Moremenu or click the downward-facing arrow that appears in the chart's header.
- You can drill back up on a chart by right-clicking the chart then selecting the Drill Upoption. Alternatively, you can hover your cursor over the chart and either select Drill Upfrom the three-dot Moremenu or click the upward-facing Drill Uparrow that appears in the chart's header.
To restore the chart to the default (highest) drill-down level, right-click the chart and then select the Reset actionoption. Alternatively, you can hover your cursor over the chart and select the Resetarrow in the chart's header. This will also reset any filters or manual sorting you've applied to the chart.
Example: Drill down to see cities in a specific country
Suppose you have a bar chart that displays Sessionsby Country. The chart has a drill-down hierarchy defined for the Countryand Citydimensions. A user wants to view the Sessionsdata broken down by Cityfor cities that are located in Canada. The user can view Citydata for Canadian cities by drilling down.
To view data for cities in Canada, the user clicks the value for Canada in the bar chart and then right-clicks the chart to select Drill Downfrom the menu options.
The bar chart will display Sessionsbroken down by Cityfor cities that are located in Canada.