

The Groupcalculated field type lets you create ad hoc custom groups for dimensions without needing to develop CASE WHEN
expressions in calculated fields or logic in SQL.
This can be helpful when you want to assign fixed labels or category names to values that match specific conditions, for example, by grouping specific states or countries into regions or order costs into categories.
This page provides an overview of how to perform the following tasks:
- Create a custom group in your data source
- Edit a custom group in your data source
- Create a chart-specific custom group
- Edit a chart-specific custom group
- Reuse a chart-specific custom group
For more information about custom groups, see the Related resources section on this page and the Create a custom group example on the About calculated fields page.
Create a custom group in your data source
You must have edit rights to the data source to create and edit calculated fields.
Custom groups that are created in data sources are available in any report that uses that data source. To create a custom group in a data source, follow these steps:
- Edit the data source .
- Click
 ADD A FIELD.
 - Select Add group.
- From the Selected field to group bydrop-down menu, select an existing field to group by.
- Specify a name in the New field namefield.
- This name is the default name that appears in your reports. You can change this name for individual charts by editing the name in the dimension picker.
- The field name must be unique.
- You can't use a reserved keyword as the field name.
- Edit the default ID that is provided in the New field IDfield, as desired. This ID is used by Looker Studio to identify a field as an alternative to the field name.
-
Define the criteria for each group.
-
In the Group Namefield, specify a label for the first group of values.
-
Select Includeor Excludefrom the Include or Excludedrop-down menu. This option specifies whether the group will include or exclude the condition criteria that you create in the next step.
-
Select a condition from the Conditiondrop-down menu.
-
Specify the values for the condition in the Group valuesfield.
If you select the
INfunction, press the Enterkey (PC) or Returnkey (Mac) to input each value. -
To add more groups for that dimension, click the Add groupbutton, and repeat the previous steps to set the group condition.
-
Optionally, select the Group remaining values as a new groupcheckbox to create a category for grouping all other values that do not satisfy any group conditions.
In the Group name for remaining valuesfield, specify a label.
-
-
Click Save.
Create a custom bin in your data source from a report
Alternatively, you can create a custom group in your data source from a report by following these steps:
- Create or edit your report .
- Click Add Datain the Datapanel.
- Select Add group.
- From the Selected field to group bydrop-down menu, select an existing field to group by.
- Specify a name in the New field namefield.
- This name is the default name that appears in your reports. You can change this name for individual charts by editing the name in the dimension picker.
- The field name must be unique.
- You can't use a reserved keyword as the field name.
- Edit the default ID that is provided in the New field IDfield, as desired. This ID is used by Looker Studio to identify a field as an alternative to the field name.
-
Define the criteria for each group.
-
In the Group Namefield, specify a label for the first group of values.
-
Select Includeor Excludefrom the Include or Excludedrop-down menu. This specifies whether the group will include or exclude the condition criteria that you create in the next step.
-
Select a condition from the Conditiondrop-down menu.
-
Specify the values for the condition in the Group valuesfield.
If you select the
INfunction, press the Enterkey (PC) or Returnkey (Mac) to input each value. -
To add more groups for that dimension, click the Add groupbutton, and repeat the previous steps to set the group condition.
-
Optionally, select the Group remaining values as a new groupcheckbox to create a category for grouping all other values that do not satisfy any group conditions.
In the Group name for remaining valuesfield, specify a label.
-
-
Click Save.
Learn more about what you can do with calculated fields and the difference between calculated fields that are created in a data source versus chart-specific calculated fields .
See the Create a custom group example on the About calculated fields page.
Edit a custom group in your data source
You must have edit rights to the data source to create and edit calculated fields.
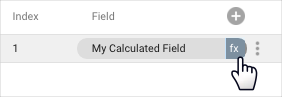
Custom groups and calculated fields appear in the data source with an fxsymbol. To edit the formula, click fxnext to the field name. This action opens the formula editor, where you can adjust the field as needed.
Create a chart-specific custom group
Field Editing in Reports must be enabled in the data source.
You must have edit rights to the report to create and edit calculated fields.
You can't reference other chart-specific calculated fields.
Chart-specific custom groups exist only in the chart in which you create them.
To create a chart-specific custom group, follow these steps:
- Create or edit your report .
- Add a new chart or select an existing chart.
- In the Setuptab of the Propertiespanel, click + Add dimension.
- At the bottom of the field list, click + ADD GROUP.
- From the Selected field to group bydrop-down menu, select an existing field to group by.
- Specify a name in the New field namefield.
- This name is the default name that appears in your reports. You can change this name for individual charts by editing the name in the dimension picker.
- The field name must be unique.
- You can't use a reserved keyword as the field name.
-
Define the criteria for each group.
-
In the Group Namefield, specify a label for the first group of values.
-
Select Includeor Excludefrom the Include or Excludedrop-down menu. This specifies whether the group will include or exclude the condition criteria that you create in the next step.
-
Select a condition from the Conditiondrop-down menu.
-
Specify the values for the condition in the Group valuesfield.
If you select the
INfunction, press the Enterkey (PC) or Returnkey (Mac) to input each value. -
To add more groups for that dimension, click the Add groupbutton, and repeat the previous steps to set the group condition.
-
Optionally, select the Group remaining values as a new groupcheckbox to create a category for grouping all other values that do not satisfy any group conditions.
In the Group name for remaining valuesfield, specify a label.
-
-
Click Save.
Learn more about what you can do with calculated fields and the difference between calculated fields that are created in a data source versus chart-specific calculated fields .
Edit a chart-specific custom group
You must have edit rights to the report to create and edit calculated fields.
Chart-specific calculated fields appear in the chart Propertiespanel on the Setuptab.
When you hover your cursor over the field type next to the field name, an fxsymbol will appear. To edit the formula, click fx.This brings up the formula editor, where you can adjust the field as needed.
Reuse a chart-specific custom group
Chart-specific calculated fields exist only in the chart in which you create them. You can't directly reuse a chart-specific calculated field nor reference it in other calculated fields.
However, you can copy a chart that contains chart-specific calculated fields. The copy will contain any calculated fields that were defined in the original. You can then edit the fields as needed in the new chart.