
Page Summary
-
ee.Imageobjects provide relational, conditional, and boolean methods for creating decision-making expressions, useful for masking, classification, and value reassignment. -
Relational methods like
eq(),gt(),gte(),lt(), andlte()perform per-pixel comparisons between images. -
Boolean methods such as
and(),or(), andnot()(orAnd(),Or(),Not()in Python) combine the results of relational operations. -
Conditional operations can be performed using ternary operators within the
expression()method or by replacing pixels based on a condition using thewhere()operator.

ee.Image
objects have a set of relational, conditional, and boolean methods for
constructing decision-making expressions. The results of these methods are useful for limiting
analysis to certain pixels or regions through masking, developing classified maps, and value
reassignment.
Relational and boolean operators
Relationalmethods include:
eq()
, gt()
, gte()
, lt()
, and lte()
Booleanmethods include:
Code Editor (JavaScript)
and()
, or()
, and not()
Colab (Python)
And()
, Or()
, and Not()
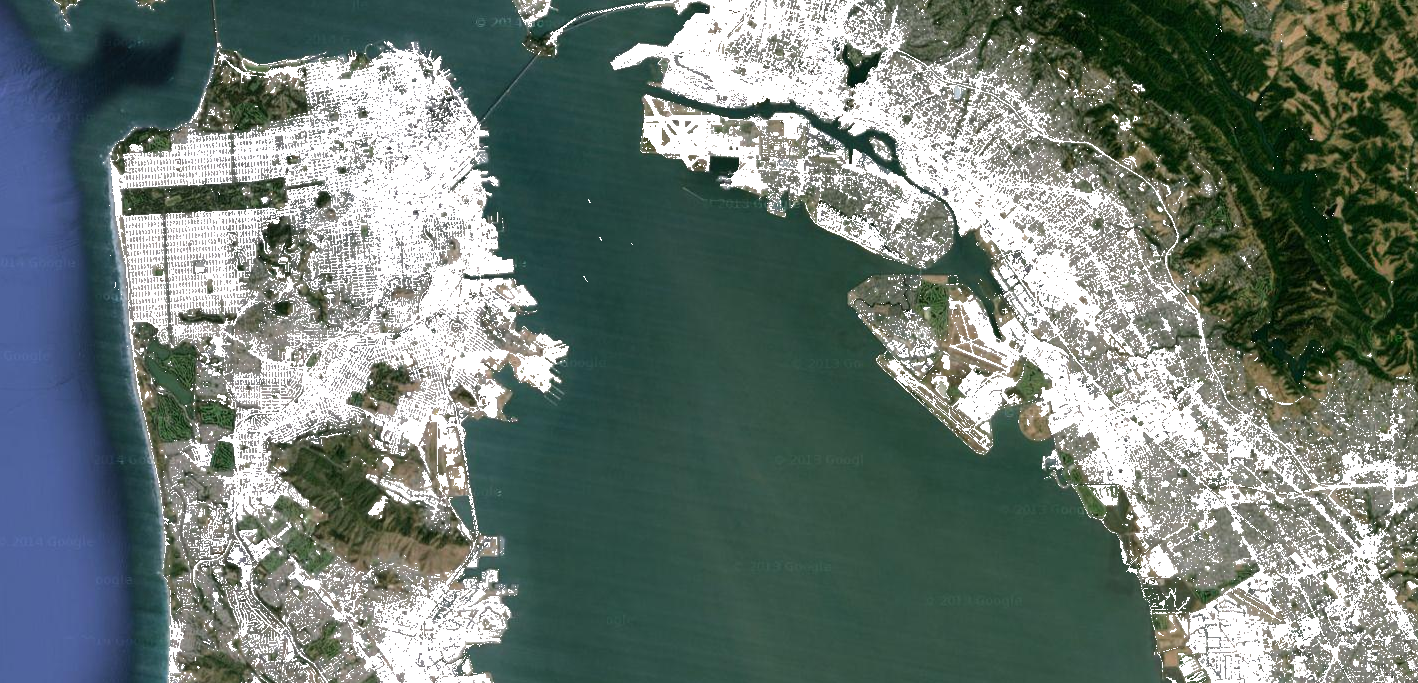
To perform per-pixel comparisons between images, use relational operators. To extract urbanized areas in an image, this example uses relational operators to threshold spectral indices, combining the thresholds with the and operator:
Code Editor (JavaScript)
 // Load a Landsat 8 image.
 var

 image

 =

 ee
 .
 Image
 (
 'LANDSAT/LC08/C02/T1_TOA/LC08_044034_20140318'
 );
 // Create NDVI and NDWI spectral indices.
 var

 ndvi

 =

 image
 .
 normalizedDifference
 ([
 'B5'
 ,

 'B4'
 ]);
 var

 ndwi

 =

 image
 .
 normalizedDifference
 ([
 'B3'
 ,

 'B5'
 ]);
 // Create a binary layer using logical operations.
 var

 bare

 =

 ndvi
 .
 lt
 (
 0.2
 ).
 and
 (
 ndwi
 .
 lt
 (
 0
 ));
 // Mask and display the binary layer.
 Map
 .
 setCenter
 (
 -
 122.3578
 ,

 37.7726
 ,

 12
 );
 Map
 .
 setOptions
 (
 'satellite'
 );
 Map
 .
 addLayer
 (
 bare
 .
 selfMask
 (),

 {},

 'bare'
 );
 import

 ee
 import

 geemap.core

 as

 geemap
Colab (Python)
 # Load a Landsat 8 image.
 image
 =
 ee
 .
 Image
 (
 'LANDSAT/LC08/C02/T1_TOA/LC08_044034_20140318'
 )
 # Create NDVI and NDWI spectral indices.
 ndvi
 =
 image
 .
 normalizedDifference
 ([
 'B5'
 ,
 'B4'
 ])
 ndwi
 =
 image
 .
 normalizedDifference
 ([
 'B3'
 ,
 'B5'
 ])
 # Create a binary layer using logical operations.
 bare
 =
 ndvi
 .
 lt
 (
 0.2
 )
 .
 And
 (
 ndwi
 .
 lt
 (
 0
 ))
 # Define a map centered on San Francisco Bay.
 map_bare
 =
 geemap
 .
 Map
 (
 center
 =
 [
 37.7726
 ,
 -
 122.3578
 ],
 zoom
 =
 12
 )
 # Add the masked image layer to the map and display it.
 map_bare
 .
 add_layer
 (
 bare
 .
 selfMask
 (),
 None
 ,
 'bare'
 )
 display
 (
 map_bare
 )
As illustrated by this example, the output of relational and boolean operators is
either true (1) or false (0). To mask the 0's, you can mask the resultant binary image
with itself using selfMask()
.
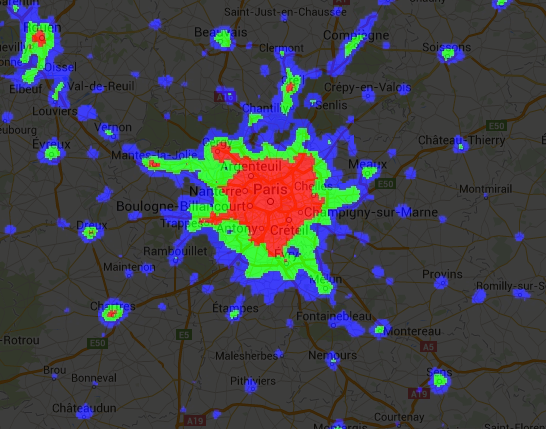
The binary images that are returned by relational and boolean operators can be used with
mathematical operators. This example creates zones of urbanization in a nighttime lights
image using relational operators and add()
:
Code Editor (JavaScript)
 // Load a 2012 nightlights image.
 var

 nl2012

 =

 ee
 .
 Image
 (
 'NOAA/DMSP-OLS/NIGHTTIME_LIGHTS/F182012'
 );
 var

 lights

 =

 nl2012
 .
 select
 (
 'stable_lights'
 );
 // Define arbitrary thresholds on the 6-bit stable lights band.
 var

 zones

 =

 lights
 .
 gt
 (
 30
 ).
 add
 (
 lights
 .
 gt
 (
 55
 )).
 add
 (
 lights
 .
 gt
 (
 62
 ));
 // Display the thresholded image as three distinct zones near Paris.
 var

 palette

 =

 [
 '000000'
 ,

 '0000FF'
 ,

 '00FF00'
 ,

 'FF0000'
 ];
 Map
 .
 setCenter
 (
 2.373
 ,

 48.8683
 ,

 8
 );
 Map
 .
 addLayer
 (
 zones
 ,

 {
 min
 :

 0
 ,

 max
 :

 3
 ,

 palette
 :

 palette
 },

 'development zones'
 );
 import

 ee
 import

 geemap.core

 as

 geemap
Colab (Python)
 # Load a 2012 nightlights image.
 nl_2012
 =
 ee
 .
 Image
 (
 'NOAA/DMSP-OLS/NIGHTTIME_LIGHTS/F182012'
 )
 lights
 =
 nl_2012
 .
 select
 (
 'stable_lights'
 )
 # Define arbitrary thresholds on the 6-bit stable lights band.
 zones
 =
 lights
 .
 gt
 (
 30
 )
 .
 add
 (
 lights
 .
 gt
 (
 55
 ))
 .
 add
 (
 lights
 .
 gt
 (
 62
 ))
 # Define a map centered on Paris, France.
 map_zones
 =
 geemap
 .
 Map
 (
 center
 =
 [
 48.8683
 ,
 2.373
 ],
 zoom
 =
 8
 )
 # Display the thresholded image as three distinct zones near Paris.
 palette
 =
 [
 '000000'
 ,
 '0000FF'
 ,
 '00FF00'
 ,
 'FF0000'
 ]
 map_zones
 .
 add_layer
 (
 zones
 ,
 {
 'min'
 :
 0
 ,
 'max'
 :
 3
 ,
 'palette'
 :
 palette
 },
 'development zones'
 )
 display
 (
 map_zones
 )
Conditional operators
Note that the code in the previous example is equivalent to using a ternary operator
implemented by expression()
:
Code Editor (JavaScript)
 // Create zones using an expression, display.
 var

 zonesExp

 =

 nl2012
 .
 expression
 (

 "(b('stable_lights') > 62) ? 3"

 +

 ": (b('stable_lights') > 55) ? 2"

 +

 ": (b('stable_lights') > 30) ? 1"

 +

 ": 0"
 );
 Map
 .
 addLayer
 (
 zonesExp
 ,

 {
 min
 :

 0
 ,

 max
 :

 3
 ,

 palette
 :

 palette
 },

 'development zones (ternary)'
 );
 import

 ee
 import

 geemap.core

 as

 geemap
Colab (Python)
 # Create zones using an expression, display.
 zones_exp
 =
 nl_2012
 .
 expression
 (
 "(b('stable_lights') > 62) ? 3 "
 ": (b('stable_lights') > 55) ? 2 "
 ": (b('stable_lights') > 30) ? 1 "
 ': 0'
 )
 # Define a map centered on Paris, France.
 map_zones_exp
 =
 geemap
 .
 Map
 (
 center
 =
 [
 48.8683
 ,
 2.373
 ],
 zoom
 =
 8
 )
 # Add the image layer to the map and display it.
 map_zones_exp
 .
 add_layer
 (
 zones_exp
 ,
 {
 'min'
 :
 0
 ,
 'max'
 :
 3
 ,
 'palette'
 :
 palette
 },
 'zones exp'
 )
 display
 (
 map_zones_exp
 )
Observe that in the previous expression example, the band of interest is referenced using
the b()
function, rather than a dictionary of variable names. Learn more
about image expressions on this page
. Using either mathematical
operators or an expression will produce the same result.
Another way to implement conditional operations on images is with the where()
operator. Consider the need to replace masked pixels with some
other data. In the following example, cloudy pixels are replaced by pixels from a
cloud-free image using where()
:
Code Editor (JavaScript)
 // Load a cloudy Sentinel-2 image.
 var

 image

 =

 ee
 .
 Image
 (

 'COPERNICUS/S2_SR/20210114T185729_20210114T185730_T10SEG'
 );
 Map
 .
 addLayer
 (
 image
 ,

 {
 bands
 :

 [
 'B4'
 ,

 'B3'
 ,

 'B2'
 ],

 min
 :

 0
 ,

 max
 :

 2000
 },

 'original image'
 );
 // Load another image to replace the cloudy pixels.
 var

 replacement

 =

 ee
 .
 Image
 (

 'COPERNICUS/S2_SR/20210109T185751_20210109T185931_T10SEG'
 );
 // Set cloudy pixels (greater than 5% probability) to the other image.
 var

 replaced

 =

 image
 .
 where
 (
 image
 .
 select
 (
 'MSK_CLDPRB'
 ).
 gt
 (
 5
 ),

 replacement
 );
 // Display the result.
 Map
 .
 setCenter
 (
 -
 122.3769
 ,

 37.7349
 ,

 11
 );
 Map
 .
 addLayer
 (
 replaced
 ,

 {
 bands
 :

 [
 'B4'
 ,

 'B3'
 ,

 'B2'
 ],

 min
 :

 0
 ,

 max
 :

 2000
 },

 'clouds replaced'
 );
 import

 ee
 import

 geemap.core

 as

 geemap
Colab (Python)
 # Load a cloudy Sentinel-2 image.
 image
 =
 ee
 .
 Image
 (
 'COPERNICUS/S2_SR/20210114T185729_20210114T185730_T10SEG'
 )
 # Load another image to replace the cloudy pixels.
 replacement
 =
 ee
 .
 Image
 (
 'COPERNICUS/S2_SR/20210109T185751_20210109T185931_T10SEG'
 )
 # Set cloudy pixels (greater than 5% probability) to the other image.
 replaced
 =
 image
 .
 where
 (
 image
 .
 select
 (
 'MSK_CLDPRB'
 )
 .
 gt
 (
 5
 ),
 replacement
 )
 # Define a map centered on San Francisco Bay.
 map_replaced
 =
 geemap
 .
 Map
 (
 center
 =
 [
 37.7349
 ,
 -
 122.3769
 ],
 zoom
 =
 11
 )
 # Display the images on a map.
 vis_params
 =
 {
 'bands'
 :
 [
 'B4'
 ,
 'B3'
 ,
 'B2'
 ],
 'min'
 :
 0
 ,
 'max'
 :
 2000
 }
 map_replaced
 .
 add_layer
 (
 image
 ,
 vis_params
 ,
 'original image'
 )
 map_replaced
 .
 add_layer
 (
 replaced
 ,
 vis_params
 ,
 'clouds replaced'
 )
 display
 (
 map_replaced
 )