Page Summary
-
Forest loss for each year can be calculated in Earth Engine using a Grouped Reducer.
-
You can group the output of
reduceRegion()by specifying a grouping band. -
The yearly forest loss area can be formatted into a dictionary with the year as the key and loss area as the value.
-
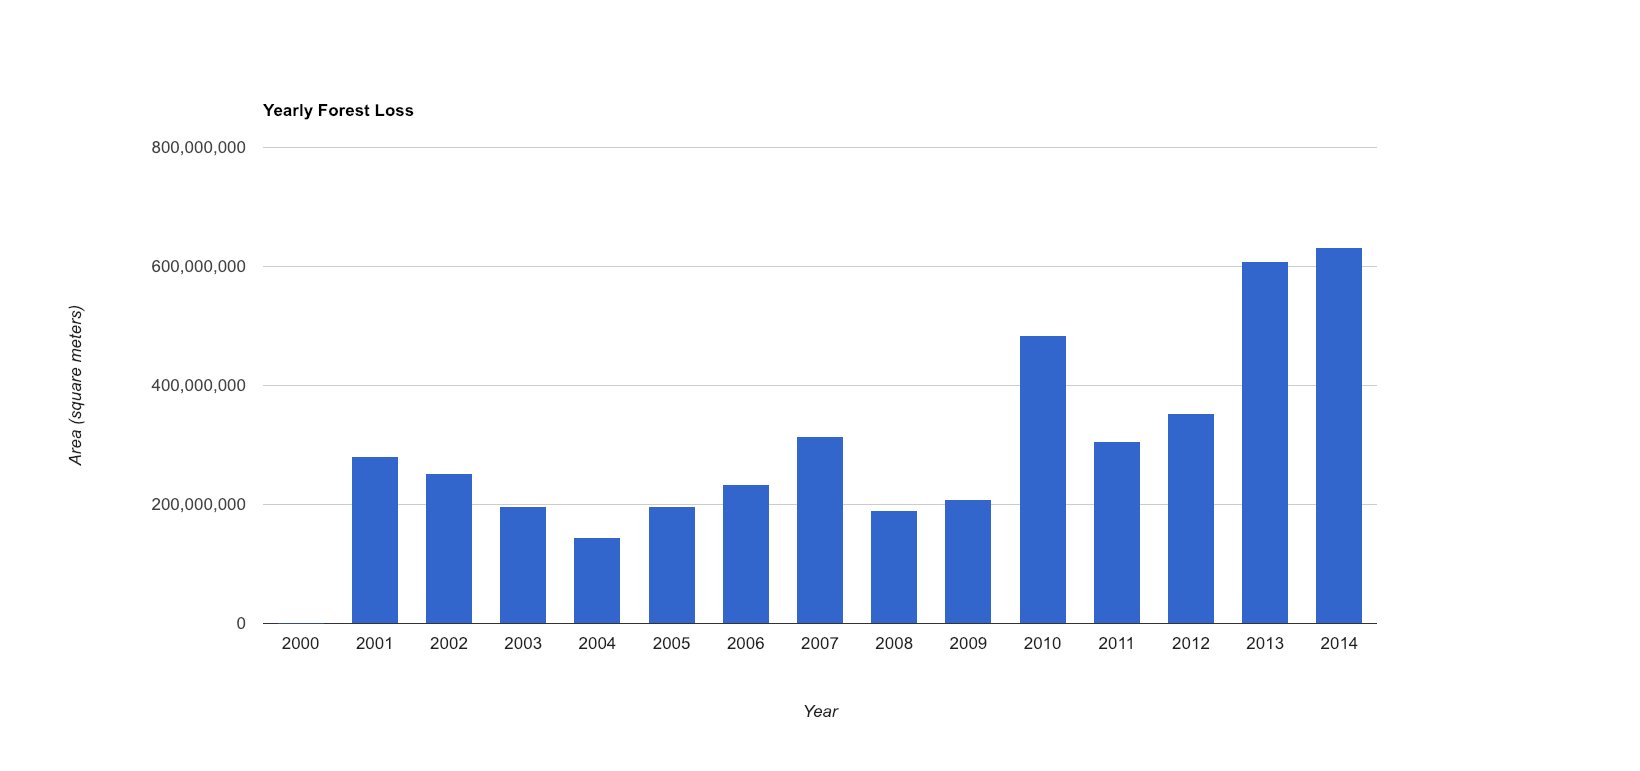
A chart showing yearly forest loss can be created using the
ui.Chart.array.values()method.
Calculating Yearly Forest Loss
In the previous section you learned how to calculate total forest area lost
in
the given region of interest using the reduceRegion
method. Instead of
calculating the total loss, it would be helpful to compute the loss for each year. The way
to achieve this in Earth Engine is using a Grouped Reducer
.
To group output of reduceRegion()
, you can specify a grouping band that
defines groups by integer pixel values. In the following example, we slightly modify the
previous code and add the lossYear
band to the original image. Each pixel in the lossYear
band contain values from 0 to 14 - indicating the year in which the
loss occurred. We also change the reducer to a grouped reducer, specifying the band index of
the grouping band (1) so the pixel areas will be summed and grouped according to the value
in the lossYear
band.
Code Editor (JavaScript)
 // Load country boundaries from LSIB.
 var

 countries

 =

 ee
 .
 FeatureCollection
 (
 'USDOS/LSIB_SIMPLE/2017'
 );
 // Get a feature collection with just the Congo feature.
 var

 congo

 =

 countries
 .
 filter
 (
 ee
 .
 Filter
 .
 eq
 (
 'country_co'
 ,

 'CF'
 ));
 // Get the loss image.
 // This dataset is updated yearly, so we get the latest version.
 var

 gfc2017

 =

 ee
 .
 Image
 (
 'UMD/hansen/global_forest_change_2017_v1_5'
 );
 var

 lossImage

 =

 gfc2017
 .
 select
 ([
 'loss'
 ]);
 var

 lossAreaImage

 =

 lossImage
 .
 multiply
 (
 ee
 .
 Image
 .
 pixelArea
 ());
 var

 lossYear

 =

 gfc2017
 .
 select
 ([
 'lossyear'
 ]);
 var

 lossByYear

 =

 lossAreaImage
 .
 addBands
 (
 lossYear
 ).
 reduceRegion
 ({

 reducer
 :

 ee
 .
 Reducer
 .
 sum
 ().
 group
 ({

 groupField
 :

 1

 }),

 geometry
 :

 congo
 ,

 scale
 :

 30
 ,

 maxPixels
 :

 1e9
 });
 print
 (
 lossByYear
 );
Once you run the above code, you will see the yearly forest loss area printed out in a nested
list called groups
. We can format the output a little to make the result a
dictionary, with year as the key and loss area as the value. Notice that we are using the format()
method to convert the year values from 0-14 to 2000-2014.
Code Editor (JavaScript)
 var

 statsFormatted

 =

 ee
 .
 List
 (
 lossByYear
 .
 get
 (
 'groups'
 ))

 .
 map
 (
 function
 (
 el
 )

 {

 var

 d

 =

 ee
 .
 Dictionary
 (
 el
 );

 return

 [
 ee
 .
 Number
 (
 d
 .
 get
 (
 'group'
 )).
 format
 (
 "20%02d"
 ),

 d
 .
 get
 (
 'sum'
 )];

 });
 var

 statsDictionary

 =

 ee
 .
 Dictionary
 (
 statsFormatted
 .
 flatten
 ());
 print
 (
 statsDictionary
 );
Making a chart
Now that we have yearly loss numbers, we are ready to prepare a chart. We will use the ui.Chart.array.values()
method. This method takes an array (or list) of input
values and an array (or list) of labels for the X-axis.
Code Editor (JavaScript)
 var

 chart

 =

 ui
 .
 Chart
 .
 array
 .
 values
 ({

 array
 :

 statsDictionary
 .
 values
 (),

 axis
 :

 0
 ,

 xLabels
 :

 statsDictionary
 .
 keys
 ()
 }).
 setChartType
 (
 'ColumnChart'
 )

 .
 setOptions
 ({

 title
 :

 'Yearly Forest Loss'
 ,

 hAxis
 :

 {
 title
 :

 'Year'
 ,

 format
 :

 '####'
 },

 vAxis
 :

 {
 title
 :

 'Area (square meters)'
 },

 legend
 :

 {

 position
 :

 "none"

 },

 lineWidth
 :

 1
 ,

 pointSize
 :

 3

 });
 print
 (
 chart
 );